


Homework Answers
1a. Nominal GDP would be the total iutput in dollars hence-
2015=275*15+180*23+135*80=$19,065
2016=330*15.75+185*25+135*88=$21,702.5
2017=345*17+202*135+135*90=$45,285
Real GDP
2015 - since this is the base year will be same as nominal=$19,065
2016= 2015 gdp+increase in output *(2015 prices)=(330-275)*15+(185-180)*23+19065=$20005
2017=2015 gdp + increase in output from 2015*(2015 price=70*16+22*23+19065=$20,691
1b. Growth rate real GDP for 2016=(20005-19065)/19065*100=4.93%
For 2017=(20691-20005)/20005*100=3.43%
1c. Gdp deflator=nominal GDP/real GDP*100
For 2015 =19065/19065*100=100
For 2016=21702.5/20005*100=108.485
For 2017=45285/20691*100=218.863
Inflation =(Deflator2-Deflator1)/Deflator 1*100
Hence, Inflation
2016=(108.485-100)/100*100=8.485%
2017=(218.863-108.485)/108.485*100=101.75%
1d.market basket for2015=gdp in 2015=19065
For 2016 basis 2015 basket Consumption=15.75*275+25*180+88*135=20711.25
For 2017=17*275+135*180+90*135=41125
Since 2015 is base CPI 2015=100
CPI2016=20711.25/19065*100=108.635
CPI 2017=41125/19065*100=215.71
CPI inflation 2016=(108.635-100)/100*100=8.635%
For 2017=(215.71-108.635)/108.635*100=98.56%
Add Answer to:
Can
you please fill out all of the questions for whoever does it the
last person...
Reference equation: Real GDP per capita growth rate Nominal GDP per capita growth rate - Inflation...
 Reference equation: Real GDP per capita growth rate Nominal GDP per capita growth rate - Inflation rate - Population growth rate This equation is an approximation of the exact rate of growth of GDP per capita, and so it results in some errors when calculating this rate. However, the simplified equation both is easy to use and results in small error terms when inflation, nominal GDP growth, and population growth are low, and so it is a useful approximation. The...
Reference equation: Real GDP per capita growth rate = Nominal GDP per capita growth rate -...
Reference equation: Real GDP per capita growth rate = Nominal GDP per capita growth rate - Inflation rate - Population growth rateThis equation is an approximation of the exact rate of growth of GDP per capita, and so it results in some errors when calculating this rate. However, the simplified equation both is easy to use and results in small error terms when inflation, nominal GDP growth, and population growth are low, and so it is a useful approximation. The...
Dle 4.14 shows national data (in billions of dollars) for the economy of Westfall. Answer the...
 Dle 4.14 shows national data (in billions of dollars) for the economy of Westfall. Answer the questions to one decimal point. late? TABLE 4.14 Change! 2015 2016 2017 Nominal GDP ($) GDP deflator (2010 = 100) Real GDP Population (millions) Real GDP per capita 850 109 958 118 833 30 27 311 28 390 a) Fill in the blanks in the table. ) What is the inflation rate in 2016? - What is the growth rate of real GDP per...
If a country's labor and capital grow at the same rate,
If a country's labor and capital grow at the same rate, is this likely to have the same impact on the growth rate of output? Yes. If labor and capital are growing at the same rate, the impact on the growth rate of output is the same. No. Growth in labor always has a bigger impact than growth in capital. No. Growth in capital always has a bigger impact than growth in labor. It depends on whether the capital share of output is larger...
GDP Inflation Deflator Rate YEAR CPI GDP %GDP | Real GDP | %RGDP (%CPI) |(2015-100) 2012...
 GDP Inflation Deflator Rate YEAR CPI GDP %GDP | Real GDP | %RGDP (%CPI) |(2015-100) 2012 231.2 95.43 1619 2013 234.72 97.11 16785 2014 236.27 98.94 17522 2015 237.83 100.00 18219 2016 242.7 01.09 1870 2017 247.91 103.02 19485 1. Calculate the annual inflation rate using the CPI. 2. Calculate the annual GDP growth rate using the GDP. 3. Explain how the inflation rate and the GDP growth have been moved. 4. Calculate the real GDP using GDP deflator by...
09 Study Problems ind answers on the McGrawHill online resouree- -t suso) ae op decimal place...
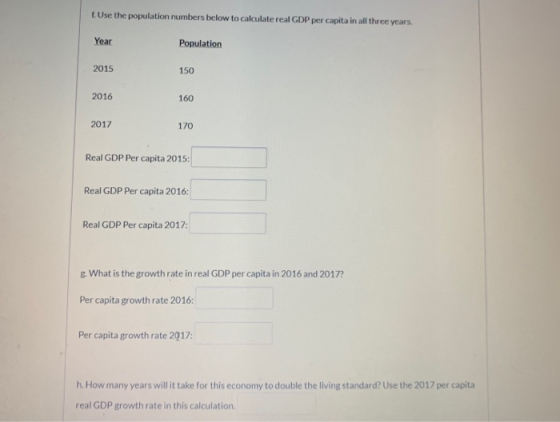
 09 Study Problems ind answers on the McGrawHill online resouree- -t suso) ae op decimal place pue () sunnb sasuy un3 jo iunoo a og ae 6 e p on)T TABLE 4.9 910 STOZ 9St 07 77+ 00t Real GDP hillions 9591 91 Population (millions a) Calculate the GDP deflator 1 2015 L102 9102 b) Calculate real GDP per capita 2015 2017 9102 cCalculate the growth rate of real GDP per capita. 2 (LO 1) The labour force data for...
5. Inflation and CPI Suppose in Economy A, the final goods produced in year 2015, 2016...
 5. Inflation and CPI Suppose in Economy A, the final goods produced in year 2015, 2016 and 2017 are milk, beef, gasoline, cloth. The quantities (Q) produced and prices (P) are given by the following: Year 2015 Qmilk Pmilk 200 2.35 220 2.49 233 2.79 (beer Pbeer lgasolin 120 3.30 400 123 3.35 430 145 3.47 440 Pgasoline (cloth Pcloth 1.12 510 2.33 1.15 512 2.47 1.20 523 2.67 2016 2017 Let 2015 be the base year and assume the...
The table below shows production and prices for a stylized economy. Assume the base year is...
 The table below shows production and prices for a stylized economy. Assume the base year is 2005. Price per unit of X(S) Production of Y Price per unit Year Production of X of Y (S) 2005 200 units 500 2010 2015 300 units 400 units Calculate nominal and real GDP for 2005, 2010 and 2015 assuming the base year is 2005 Calculate the GDP deflator for 2005, 2010, and 2015. What is the inflation rate between 2005 and 2010? Between...
we were como THAIGAL NOTEBOOKS AL GRAMING TRUM CHAPTER 4 MEASURING THE ECONOMY : UNEMPLOYMENT AND...
 we were como THAIGAL NOTEBOOKS AL GRAMING TRUM CHAPTER 4 MEASURING THE ECONOMY : UNEMPLOYMENT AND INSLATION 161 Calculate real incaunes. - 2016: - 2017: 2015: - Calculate the percentage that real incomes rose. 2017 three countries tall with the same base year with figures converted to Canadian 2016 (LO3) The data for three dollars are shown in Table 4.12. TABLE 4.12 Population millions) Nominal GDP 15billions Price Index 2009 - 100 35 140 $ 715 2200 2875 Altria Bergan...
7. (LO1,2) Table 4.13 shows national data (in billions of dollars) for the economy of Westfall....
 7. (LO1,2) Table 4.13 shows national data (in billions of dollars) for the economy of Westfall. Answer the questions to one decimal point. inflation rate a) Complete TABLE 4.13 TABLE 4.15 2013 2014 2015 Year Nomina 850 958 $36 109 118 Nominal GDP ($) GDP deflator (2010 = 100) Real GDP Population (millions) Real GDP per capita 833 G EWN- 30 27311 28 390 b) What will be a) Fill in the blanks in the table. b) What is the...
 Reference equation: Real GDP per capita growth rate Nominal GDP per capita growth rate - Inflation rate - Population growth rate This equation is an approximation of the exact rate of growth of GDP per capita, and so it results in some errors when calculating this rate. However, the simplified equation both is easy to use and results in small error terms when inflation, nominal GDP growth, and population growth are low, and so it is a useful approximation. The...
 Dle 4.14 shows national data (in billions of dollars) for the economy of Westfall. Answer the questions to one decimal point. late? TABLE 4.14 Change! 2015 2016 2017 Nominal GDP ($) GDP deflator (2010 = 100) Real GDP Population (millions) Real GDP per capita 850 109 958 118 833 30 27 311 28 390 a) Fill in the blanks in the table. ) What is the inflation rate in 2016? - What is the growth rate of real GDP per...
 GDP Inflation Deflator Rate YEAR CPI GDP %GDP | Real GDP | %RGDP (%CPI) |(2015-100) 2012 231.2 95.43 1619 2013 234.72 97.11 16785 2014 236.27 98.94 17522 2015 237.83 100.00 18219 2016 242.7 01.09 1870 2017 247.91 103.02 19485 1. Calculate the annual inflation rate using the CPI. 2. Calculate the annual GDP growth rate using the GDP. 3. Explain how the inflation rate and the GDP growth have been moved. 4. Calculate the real GDP using GDP deflator by...
 09 Study Problems ind answers on the McGrawHill online resouree- -t suso) ae op decimal place pue () sunnb sasuy un3 jo iunoo a og ae 6 e p on)T TABLE 4.9 910 STOZ 9St 07 77+ 00t Real GDP hillions 9591 91 Population (millions a) Calculate the GDP deflator 1 2015 L102 9102 b) Calculate real GDP per capita 2015 2017 9102 cCalculate the growth rate of real GDP per capita. 2 (LO 1) The labour force data for...
 5. Inflation and CPI Suppose in Economy A, the final goods produced in year 2015, 2016 and 2017 are milk, beef, gasoline, cloth. The quantities (Q) produced and prices (P) are given by the following: Year 2015 Qmilk Pmilk 200 2.35 220 2.49 233 2.79 (beer Pbeer lgasolin 120 3.30 400 123 3.35 430 145 3.47 440 Pgasoline (cloth Pcloth 1.12 510 2.33 1.15 512 2.47 1.20 523 2.67 2016 2017 Let 2015 be the base year and assume the...
 The table below shows production and prices for a stylized economy. Assume the base year is 2005. Price per unit of X(S) Production of Y Price per unit Year Production of X of Y (S) 2005 200 units 500 2010 2015 300 units 400 units Calculate nominal and real GDP for 2005, 2010 and 2015 assuming the base year is 2005 Calculate the GDP deflator for 2005, 2010, and 2015. What is the inflation rate between 2005 and 2010? Between...
 we were como THAIGAL NOTEBOOKS AL GRAMING TRUM CHAPTER 4 MEASURING THE ECONOMY : UNEMPLOYMENT AND INSLATION 161 Calculate real incaunes. - 2016: - 2017: 2015: - Calculate the percentage that real incomes rose. 2017 three countries tall with the same base year with figures converted to Canadian 2016 (LO3) The data for three dollars are shown in Table 4.12. TABLE 4.12 Population millions) Nominal GDP 15billions Price Index 2009 - 100 35 140 $ 715 2200 2875 Altria Bergan...
 7. (LO1,2) Table 4.13 shows national data (in billions of dollars) for the economy of Westfall. Answer the questions to one decimal point. inflation rate a) Complete TABLE 4.13 TABLE 4.15 2013 2014 2015 Year Nomina 850 958 $36 109 118 Nominal GDP ($) GDP deflator (2010 = 100) Real GDP Population (millions) Real GDP per capita 833 G EWN- 30 27311 28 390 b) What will be a) Fill in the blanks in the table. b) What is the...
Most questions answered within 3 hours.
-
The blues made its way into many kinds of music. Eric Clapton,
The Beatles, and Elvis...
asked 8 minutes ago -
If you’re standing at the bottom of a hill and asked to evaluate
it while being...
asked 1 hour ago -
1. Which region has taken the lead in the world of
e-waste handling?
a) European Union...
asked 57 minutes ago -
A 8.15- g bullet from a 9-mm pistol has a velocity of 366.0 m/s.
It strikes...
asked 2 hours ago -
The outstanding bonds of Alpha Extracts have a yield to maturity
of 7.4 percent and a...
asked 2 hours ago -
The Problem: The Case of the Harmonizing Vacations
Your CEO is exploring partnering with a European...
asked 3 hours ago -
A chemical equation is balanced by adding coefficients in front
of some formulas so that the...
asked 3 hours ago -
From the literature (reference your sources): What are the
lattice parameters of calcite and aragonite? Why...
asked 4 hours ago -
Your system is rejecting the question am asking which is
preceded by a case study. It...
asked 4 hours ago -
3. On January 2, 2000, Larry creates a trust with himself as
trustee. Larry as trustee...
asked 4 hours ago -
A member of the volleyball team spikes the ball. During this
process, she changes the velocity...
asked 4 hours ago -
Are adult gamers less likely to use a gaming console (Xbox,
PlayStation, Wii, etc...) than teen...
asked 5 hours ago