
Homework Answers
This question requires application of 68-95-99 rule of statistics, according to which
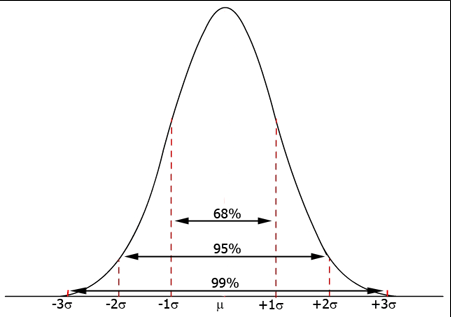
68% of times, the values in a normal distribution would lie within + and - 1 standard deviation of mean.
95% of times, the values in a normal distribution would lie within + and - 2 standard deviation of mean.
Question a
For 68%, the confidence interval will be within +1 and -1 of standard deviation.
Lower level = 12.1% - (1 * 19.8%) = -7.70%
Higher level = 12.1% + (1 * 19.8%) = 31.90%
Question b
For 95%, the confidence interval will be within +2 and -2 of standard deviation.
Lower level = 12.1% - (2 * 19.8%) = -27.50%
Higher level = 12.1% + (2 * 19.8%) = 51.70%
Add Answer to:
Consider the following table for different assets for 1926 through 2017. 8.3 Series Large-company stocks Small-company...
Consider the following table for different assets for 1926 through 2017 Average return Standard Deviation 12.1...
 Consider the following table for different assets for 1926 through 2017 Average return Standard Deviation 12.1 % Series Large-company stocks Small-company stocks Long-term corporate bonds Long-term government bonds Intermediate-term government 19.8% 16.5 31.7 6.4 8.3 6.0 9.9 5.2 5.6 bonds 3.4 U.S. Treasury bills Inflation 3.1 3.0 4.0 a. What range of returns would you expect to see 68 percent of the time for long-term corporate bonds? (A negative answer should be indicated by a minus sign. Enter your answers...
Average return Standard Deviation 12.1 % Series Large-company stocks Small-company stocks Long-term corporate bonds Long-term government...
 Average return Standard Deviation 12.1 % Series Large-company stocks Small-company stocks Long-term corporate bonds Long-term government bonds Intermediate-term government bonds U.S. Treasury bills Inflation 19.8% 31.7 16.5 6.4 8.3 6.0 9.9 5.2 5.6 3.4 3.1 3.0 4.0 a. What range of returns would you expect to see 68 percent of the time for long-term corporate bonds? (A negative answer should be indicated by a minus sign. Enter your answers from lowest to highest. Do not round intermediate calculations and enter...
Consider the following table for the total annual returns for a given period of time. Series...
 Consider the following table for the total annual returns for a given period of time. Series Large-company stocks Small-company stocks Long-term corporate bonds Long-term government bonds Intermediate-term government bonds U.S. Treasury bills Inflation Average return 10.9% 16.4 6.2 6.1 Standard Deviation 21.2% 33.0 8.4 9.4 5.7 3.1 4.2. اي اسيا ني ܗ ܗ ܝ What range of returns would you expect to see 68 percent of the time for large-company stocks? (A negative answer should be indicated by a minus...
Use the following table of returns from 1926 through 2017: Series Large stocks Small stocks Long-term...
 Use the following table of returns from 1926 through 2017: Series Large stocks Small stocks Long-term corporate bonds Long-term government bonds U.S. Treasury bills Inflation Average return 12.1% 16.5 6.4 6.0 3.4 3.0 a. Determine the return on a portfolio that was equally invested in large-company stocks and long-term corporate bonds. (Do not round intermediate calculations and enter your answer as a percent rounded to 2 decimal places, e.g., 32.16.) b. What was the return on a portfolio that was...
Consider the following table for the total annual returns for a given period of time. Series...
Consider the following table for the total annual returns for a given period of time. Series Average return Standard Deviation Large-company stocks 11.7 % 20.6 % Small-company stocks 16.4 33.0 Long-term corporate bonds 6.7 10.0 Long-term government bonds 6.1 9.4 Intermediate-term government bonds 5.6 5.7 U.S. Treasury bills 3.8 3.1 Inflation 3.1 4.2 Requirement 1: What range of returns would you expect to see 95 percent of the time for long-term corporate bonds? (Negative amount should be indicated by a...
Problem 10-17 Return Distributions [LO 3] Consider the following table for the total annual returns for...
Problem 10-17 Return Distributions [LO 3] Consider the following table for the total annual returns for a given period of time. Series Average return Standard Deviation Large-company stocks 11.7 % 20.6 % Small-company stocks 16.4 33.0 Long-term corporate bonds 6.1 8.8 Long-term government bonds 6.1 9.4 Intermediate-term government bonds 5.6 5.7 U.S. Treasury bills 3.8 3.1 Inflation 3.1 4.2 What range of returns would you expect to see 95 percent of the time for long-term corporate bonds? (A negative answer...
Use the following table of returns from 1926 through 2017: Average return 12.1% 16.5 Series Large...
 Use the following table of returns from 1926 through 2017: Average return 12.1% 16.5 Series Large stocks Small stocks Long-term corporate bonds Long-term government bonds U.S. Treasury bills Inflation 6.4 6.0 3.4 3.0 a. Determine the return on a portfolio that was equally invested in large-company stocks and long-term corporate bonds. (Do not round intermediate calculations and enter your answer as a percent rounded to 2 decimal places, e.g., 32.16.) b. What was the return on a portfolio that was...
Suppose the returns on long-term government bonds are normally distributed. Assume long-term government bonds have a...
 Suppose the returns on long-term government bonds are normally distributed. Assume long-term government bonds have a mean return of 6.0 percent and a standard deviation of 9.9 percent. a. What is the approximate probability that your return on these bonds will be less than -3.9 percent in a given year? Use the NORMDIST function in Excel® to answer this question. (Do not round intermediate calculations and enter your answer as a percent rounded to 2 decimal places, e.g., 32.16.) b....
Suppose the returns on long-term government bonds are normally distributed. Assume long-term government bonds have a...
 Suppose the returns on long-term government bonds are normally distributed. Assume long-term government bonds have a mean return of 6.0 percent and a standard deviation of 9.9 percent. a. What is the approximate probability that your return on these bonds will be less than -3.9 percent in a given year? Use the NORMDIST function in Excel to answer this question. (Do not round intermediate calculations and enter your answer as a percent rounded to 2 decimal places, e.g., 32.16.) b....
Suppose the returns on long-term government bonds are normally distributed. Assume long-term government bonds have a...
 Suppose the returns on long-term government bonds are normally distributed. Assume long-term government bonds have a mean return of 6.0 percent and a standard deviation of 9.9 percent. a. What is the approximate probability that your return on these bonds will be less than -3.9 percent in a given year? Use the NORMDIST function in Excel® to answer this question. (Do not round intermediate calculations and enter your answer as a percent rounded to 2 decimal places, e.g., 32.16.) b.What...
 Consider the following table for different assets for 1926 through 2017 Average return Standard Deviation 12.1 % Series Large-company stocks Small-company stocks Long-term corporate bonds Long-term government bonds Intermediate-term government 19.8% 16.5 31.7 6.4 8.3 6.0 9.9 5.2 5.6 bonds 3.4 U.S. Treasury bills Inflation 3.1 3.0 4.0 a. What range of returns would you expect to see 68 percent of the time for long-term corporate bonds? (A negative answer should be indicated by a minus sign. Enter your answers...
 Average return Standard Deviation 12.1 % Series Large-company stocks Small-company stocks Long-term corporate bonds Long-term government bonds Intermediate-term government bonds U.S. Treasury bills Inflation 19.8% 31.7 16.5 6.4 8.3 6.0 9.9 5.2 5.6 3.4 3.1 3.0 4.0 a. What range of returns would you expect to see 68 percent of the time for long-term corporate bonds? (A negative answer should be indicated by a minus sign. Enter your answers from lowest to highest. Do not round intermediate calculations and enter...
 Consider the following table for the total annual returns for a given period of time. Series Large-company stocks Small-company stocks Long-term corporate bonds Long-term government bonds Intermediate-term government bonds U.S. Treasury bills Inflation Average return 10.9% 16.4 6.2 6.1 Standard Deviation 21.2% 33.0 8.4 9.4 5.7 3.1 4.2. اي اسيا ني ܗ ܗ ܝ What range of returns would you expect to see 68 percent of the time for large-company stocks? (A negative answer should be indicated by a minus...
 Use the following table of returns from 1926 through 2017: Series Large stocks Small stocks Long-term corporate bonds Long-term government bonds U.S. Treasury bills Inflation Average return 12.1% 16.5 6.4 6.0 3.4 3.0 a. Determine the return on a portfolio that was equally invested in large-company stocks and long-term corporate bonds. (Do not round intermediate calculations and enter your answer as a percent rounded to 2 decimal places, e.g., 32.16.) b. What was the return on a portfolio that was...
 Use the following table of returns from 1926 through 2017: Average return 12.1% 16.5 Series Large stocks Small stocks Long-term corporate bonds Long-term government bonds U.S. Treasury bills Inflation 6.4 6.0 3.4 3.0 a. Determine the return on a portfolio that was equally invested in large-company stocks and long-term corporate bonds. (Do not round intermediate calculations and enter your answer as a percent rounded to 2 decimal places, e.g., 32.16.) b. What was the return on a portfolio that was...
 Suppose the returns on long-term government bonds are normally distributed. Assume long-term government bonds have a mean return of 6.0 percent and a standard deviation of 9.9 percent. a. What is the approximate probability that your return on these bonds will be less than -3.9 percent in a given year? Use the NORMDIST function in Excel® to answer this question. (Do not round intermediate calculations and enter your answer as a percent rounded to 2 decimal places, e.g., 32.16.) b....
 Suppose the returns on long-term government bonds are normally distributed. Assume long-term government bonds have a mean return of 6.0 percent and a standard deviation of 9.9 percent. a. What is the approximate probability that your return on these bonds will be less than -3.9 percent in a given year? Use the NORMDIST function in Excel to answer this question. (Do not round intermediate calculations and enter your answer as a percent rounded to 2 decimal places, e.g., 32.16.) b....
 Suppose the returns on long-term government bonds are normally distributed. Assume long-term government bonds have a mean return of 6.0 percent and a standard deviation of 9.9 percent. a. What is the approximate probability that your return on these bonds will be less than -3.9 percent in a given year? Use the NORMDIST function in Excel® to answer this question. (Do not round intermediate calculations and enter your answer as a percent rounded to 2 decimal places, e.g., 32.16.) b.What...
Most questions answered within 3 hours.
-
3. Gains from trade
Consider two neighbouring island countries called Euphoria and
Contente. They each have...
asked 1 hour ago -
A business executive has the option to invest money in two
plans: Plan A guarantees that...
asked 3 hours ago -
Hello, can someone please help me answer this question?
How much heat is absorbed by a...
asked 3 hours ago -
. A marketing researcher conducted a survey of 25 shoppers
randomly selected at the local mall...
asked 3 hours ago -
Create an comprehensive response to the
following:
Antimicrobial agents work on a multitude of microbes (bacteria,...
asked 3 hours ago -
6.13 LAB: Step counter. Section 6.3.
A pedometer treats walking 2,000 steps as walking 1 mile....
asked 3 hours ago -
(14.2) A block of mass m = 10 kg riding on a frictionless
horizontal plane is...
asked 3 hours ago -
Use any search engine to search for articles about Starbucks
partnership with Tata Companies in India...
asked 3 hours ago -
Let’s say that for some reason Bank Excess Reserves suddenly
increase sharply. What effect would this...
asked 3 hours ago -
Given:
Curent Assets: $600,000
Total Assets: $2,600,000
Current Liabilities: $500,000
Total Liabilities: $1,700,000
What is the...
asked 4 hours ago -
1. What is a “Bankster”? What is insider trading? Why is it
illegal?
2. What is...
asked 4 hours ago -
A transverse wave on a cord is given by
D(x,t)=0.18sin(2.7x−61.0t), where Dand x are in m...
asked 4 hours ago