2. Compute the tax liabilities for each year along with tracking any NOL. The company's objective...
| 2. | Compute the tax liabilities for each year along with tracking any NOL. | ||||||
| The company's objective is to use the carryback and then the carryforward to ensure its | |||||||
| tax liability is as small as possible | |||||||
| These figures are for a company with yearly revenues of over $15 million | |||||||
| Net Income/ | Net Income/ | ||||||
| a. | (Loss) | b. | (Loss) | ||||
| 2001 | 20,000 | 2001 | (25,000) | ||||
| 2002 | 12,000 | 2002 | (1,000) | ||||
| 2003 | (13,000) | 2003 | 4,000 | ||||
| 2004 | 4,000 | 2004 | 6,000 | ||||
| 2005 | 8,000 | 2005 | (5,000) | ||||
| 2006 | 9,000 | 2006 | 7,000 | ||||
| 2007 | (3,000) | 2007 | 6,000 | ||||
| 2008 | (2,000) | ||||||
| 2009 | 9,000 | ||||||
| (check figure: tax liability = 5,550) | (check figure: tax liability = 0) | ||||||
Homework Answers
Given question is related to taxation and have to calculate tax liability for the given current periods.
Refer below images for detail solution.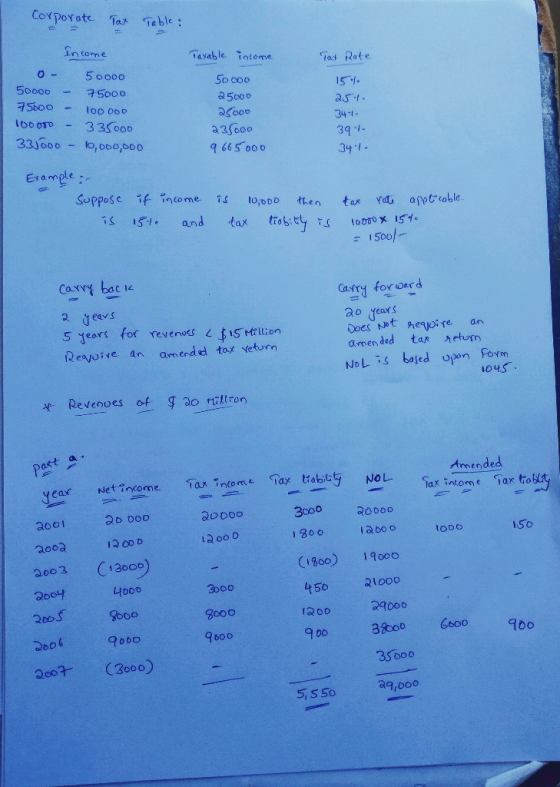

Add Answer to:
2.
Compute the tax liabilities for each year along with tracking any
NOL.
The
company's objective...
Compute the tak liabilities for each year along with tracking any NOL. The company's objective is...
 Compute the tak liabilities for each year along with tracking any NOL. The company's objective is to use the carryback and then the carryforward to ensure its tax liability is as small as possible These figures are for a company with yearly revenues of over $15 million 2001 2002 Net Income! (Loss) 20,000 12,000 (13,000) 4,000 8,000 9,000 (3,000) 2001 2002 2003 2004 2005 2006 2007 2003 2004 2005 2006 2007 2008 2009 Net Income! (Loss) (25,000) (1,000) 4,000 6,000...
7.9 3.3 2. Consider the following data from 2001 - 2017, column 1 is the year,...
 7.9 3.3 2. Consider the following data from 2001 - 2017, column 1 is the year, the 2nd column is the unemployment rate, and the 3rd column is the inflation rate. Plot the data using a scatter plot and argue whether in your opinion, the Phillips Curve has validity. 2001 5.7 1.6 2002 6.0 2.4 2003 5.7 2004 2005 2006 2007 2008 2009 2010 2011 2012 2013 2014 2015 2016 2017 4.1 3.0 0.7
Here are the number of domestic flights flown in each year from 2000 to 2016 Year...
Here are the number of domestic flights flown in each year from 2000 to 2016 Year Flights 2000 7,905,617 2001 7,626,312 2002 8,085,083 2003 9,458,818 2004 9,968,047 2005 10,038,373 2006 9,712,750 2007 9,839,578 2008 9,378,227 2009 8,768,938 2010 8,702,365 2011 8,649,087 2012 8,446,201 2013 8,323,938 2014 8,107,802 2015 8,061,158 2016 4,036,068 In turns out that the value reported for 2016 was only for the period January to June. What should we have done with that point?
Year Period (t) Enrollment (1000s) 2001 1 6.5 2002 2 8.1 2003 3 8.4 2004 4...
Year Period (t) Enrollment (1000s) 2001 1 6.5 2002 2 8.1 2003 3 8.4 2004 4 10.2 2005 5 12.5 2006 6 13.3 2007 7 13.7 2008 8 17.2 2009 9 18.1 a. The data shows the enrollment for the college for the nine most recent years. Construct a time-series plot. What type of pattern exists in the data? b. Use simple linear regression analysis to find the parameters for the line that minimizes MSE for this time series. (using Period...
ncio.wwnortm e Page(s) 444-445 14.1. Exactly what happened during the Great Recession and the Great Depression?...
 ncio.wwnortm e Page(s) 444-445 14.1. Exactly what happened during the Great Recession and the Great Depression? Refer to the figure below and fill in the blanks to complete the following passage. Consumer 110 Sentiment Inder 100 Great Recession 8 3 2001 2002 2003 2004 2005 2006 2007 2008 2009 2010 2011 2012 Drag word(s) below to fill in the blank(s) in the passage. Economists use the which is graphed above, as a measure of consumers' confidence in their financial future....
The accompanying data table show the percentage of tax returns filed electronically in a city from...
 The accompanying data table show the percentage of tax returns
filed electronically in a city from 2000 to 2009. Complete parts a
through e below.
B.) Calculate the MAD for the forecast in part a
C.) Forecast the percentage of tax returns that will be
electronically filed for 2010 using exponential smoothing with
trend adjustment. set = 0.4 and
= 0.5
D.) Calculate the MAD for the forecast in part c
E.) In which forecast do you have the most...
The accompanying data table show the percentage of tax returns
filed electronically in a city from 2000 to 2009. Complete parts a
through e below.
B.) Calculate the MAD for the forecast in part a
C.) Forecast the percentage of tax returns that will be
electronically filed for 2010 using exponential smoothing with
trend adjustment. set = 0.4 and
= 0.5
D.) Calculate the MAD for the forecast in part c
E.) In which forecast do you have the most...
Name Paper Assignment No. 3 Chapter 4 Due Tuesday, February 5, 2019 Year Sales Net Income...
 Name Paper Assignment No. 3 Chapter 4 Due Tuesday, February 5, 2019 Year Sales Net Income 2000 55.0 7.7 2001 594 10.1 2002 71.3 7. 003 95.0 18.1 2004 114.0 16.0 2005 164.2 18.1 2006 131.4 13.1 2007 1971 29.6 2008 236.5 26.0 2009 312.2 56.2 2010 374.6 45.0 2011 408,7 45.0 2012 392.3 58.8 2012 588.5 58.9 2014 706.2 77.7 2015 762.6 99.1 2016 915.2 91.5 2017 1464.3 175.7 2018 11714 152.3 For cach variable, calculate the following statistics...
125% Insert Tablc Chart Zoom Check Register Bank Reconciliation Bank Statement 2 Bank Statement First Bank...
 125% Insert Tablc Chart Zoom Check Register Bank Reconciliation Bank Statement 2 Bank Statement First Bank Virginia Beach, VA Customer: My Company Statement date: 30-Sep-19 1111 College Way Virginia Beach, VA Account # 4654389 September 1 Beginning Balance $ 16,850.00 + Deposits and other Credits $ 22,367.00 - Checks and other Debits $ (11,822.00) September 30 ENDING BALANCE $ 27,395.00 Deposits and Other Credits 1-Sep $1,500.00 $2,514.00 25-Sep 29-Sep $10,000.00 $ 4,500.00 15-Sep 16-Sep 20-Sep $ 350.00 $ 500.00 Interest...
E12-4 (A) through (G) please answer each da bodo interest on and the F12-2 Juary 1...
 E12-4 (A) through (G)
please answer each
da bodo interest on and the F12-2 Juary 1 2004. bones Company On The bonds pay interest on was 5875,37 Required: the the c. Explain Was the market interest rate on January 1, 2004, s h coupon rate on the bonds e w Prepare the journal entry to issue the bonds Explain how an increase in market interest rates during 2006 will stic (1) Jones Company (2) The original bondholders who sell the...
E12-4 (A) through (G)
please answer each
da bodo interest on and the F12-2 Juary 1 2004. bones Company On The bonds pay interest on was 5875,37 Required: the the c. Explain Was the market interest rate on January 1, 2004, s h coupon rate on the bonds e w Prepare the journal entry to issue the bonds Explain how an increase in market interest rates during 2006 will stic (1) Jones Company (2) The original bondholders who sell the...
Compare inventory turns, ROA, and ROE for Apple and their competitor Samsung, at the time the...
 Compare inventory turns, ROA, and ROE for Apple and their
competitor Samsung, at the time the case was written. Briefly
provide the computation for each one (state which year(s) you
used). Look at the big picture-- how do they compare?
EXHIBIT 11: APPLE'S HISTORICAL FINANCIAL INFORMATION (SELECTED) FY 2013 FY 2012 FY 2011 9/28/2013 9/29/2012 9/24/2011 Net sales 170.910.000 156.508,000 108.249.000 Cost of sales 106,606,000 87,846,000 64,431,000 Gross margin 64,304,000 68,662,000 43,818,000 Research & development expense L 4.475.000 3.381.000 2.429.000...
Compare inventory turns, ROA, and ROE for Apple and their
competitor Samsung, at the time the case was written. Briefly
provide the computation for each one (state which year(s) you
used). Look at the big picture-- how do they compare?
EXHIBIT 11: APPLE'S HISTORICAL FINANCIAL INFORMATION (SELECTED) FY 2013 FY 2012 FY 2011 9/28/2013 9/29/2012 9/24/2011 Net sales 170.910.000 156.508,000 108.249.000 Cost of sales 106,606,000 87,846,000 64,431,000 Gross margin 64,304,000 68,662,000 43,818,000 Research & development expense L 4.475.000 3.381.000 2.429.000...
 Compute the tak liabilities for each year along with tracking any NOL. The company's objective is to use the carryback and then the carryforward to ensure its tax liability is as small as possible These figures are for a company with yearly revenues of over $15 million 2001 2002 Net Income! (Loss) 20,000 12,000 (13,000) 4,000 8,000 9,000 (3,000) 2001 2002 2003 2004 2005 2006 2007 2003 2004 2005 2006 2007 2008 2009 Net Income! (Loss) (25,000) (1,000) 4,000 6,000...
 7.9 3.3 2. Consider the following data from 2001 - 2017, column 1 is the year, the 2nd column is the unemployment rate, and the 3rd column is the inflation rate. Plot the data using a scatter plot and argue whether in your opinion, the Phillips Curve has validity. 2001 5.7 1.6 2002 6.0 2.4 2003 5.7 2004 2005 2006 2007 2008 2009 2010 2011 2012 2013 2014 2015 2016 2017 4.1 3.0 0.7
 ncio.wwnortm e Page(s) 444-445 14.1. Exactly what happened during the Great Recession and the Great Depression? Refer to the figure below and fill in the blanks to complete the following passage. Consumer 110 Sentiment Inder 100 Great Recession 8 3 2001 2002 2003 2004 2005 2006 2007 2008 2009 2010 2011 2012 Drag word(s) below to fill in the blank(s) in the passage. Economists use the which is graphed above, as a measure of consumers' confidence in their financial future....
 The accompanying data table show the percentage of tax returns
filed electronically in a city from 2000 to 2009. Complete parts a
through e below.
B.) Calculate the MAD for the forecast in part a
C.) Forecast the percentage of tax returns that will be
electronically filed for 2010 using exponential smoothing with
trend adjustment. set = 0.4 and
= 0.5
D.) Calculate the MAD for the forecast in part c
E.) In which forecast do you have the most...
The accompanying data table show the percentage of tax returns
filed electronically in a city from 2000 to 2009. Complete parts a
through e below.
B.) Calculate the MAD for the forecast in part a
C.) Forecast the percentage of tax returns that will be
electronically filed for 2010 using exponential smoothing with
trend adjustment. set = 0.4 and
= 0.5
D.) Calculate the MAD for the forecast in part c
E.) In which forecast do you have the most...
 Name Paper Assignment No. 3 Chapter 4 Due Tuesday, February 5, 2019 Year Sales Net Income 2000 55.0 7.7 2001 594 10.1 2002 71.3 7. 003 95.0 18.1 2004 114.0 16.0 2005 164.2 18.1 2006 131.4 13.1 2007 1971 29.6 2008 236.5 26.0 2009 312.2 56.2 2010 374.6 45.0 2011 408,7 45.0 2012 392.3 58.8 2012 588.5 58.9 2014 706.2 77.7 2015 762.6 99.1 2016 915.2 91.5 2017 1464.3 175.7 2018 11714 152.3 For cach variable, calculate the following statistics...
 125% Insert Tablc Chart Zoom Check Register Bank Reconciliation Bank Statement 2 Bank Statement First Bank Virginia Beach, VA Customer: My Company Statement date: 30-Sep-19 1111 College Way Virginia Beach, VA Account # 4654389 September 1 Beginning Balance $ 16,850.00 + Deposits and other Credits $ 22,367.00 - Checks and other Debits $ (11,822.00) September 30 ENDING BALANCE $ 27,395.00 Deposits and Other Credits 1-Sep $1,500.00 $2,514.00 25-Sep 29-Sep $10,000.00 $ 4,500.00 15-Sep 16-Sep 20-Sep $ 350.00 $ 500.00 Interest...
 E12-4 (A) through (G)
please answer each
da bodo interest on and the F12-2 Juary 1 2004. bones Company On The bonds pay interest on was 5875,37 Required: the the c. Explain Was the market interest rate on January 1, 2004, s h coupon rate on the bonds e w Prepare the journal entry to issue the bonds Explain how an increase in market interest rates during 2006 will stic (1) Jones Company (2) The original bondholders who sell the...
E12-4 (A) through (G)
please answer each
da bodo interest on and the F12-2 Juary 1 2004. bones Company On The bonds pay interest on was 5875,37 Required: the the c. Explain Was the market interest rate on January 1, 2004, s h coupon rate on the bonds e w Prepare the journal entry to issue the bonds Explain how an increase in market interest rates during 2006 will stic (1) Jones Company (2) The original bondholders who sell the...
 Compare inventory turns, ROA, and ROE for Apple and their
competitor Samsung, at the time the case was written. Briefly
provide the computation for each one (state which year(s) you
used). Look at the big picture-- how do they compare?
EXHIBIT 11: APPLE'S HISTORICAL FINANCIAL INFORMATION (SELECTED) FY 2013 FY 2012 FY 2011 9/28/2013 9/29/2012 9/24/2011 Net sales 170.910.000 156.508,000 108.249.000 Cost of sales 106,606,000 87,846,000 64,431,000 Gross margin 64,304,000 68,662,000 43,818,000 Research & development expense L 4.475.000 3.381.000 2.429.000...
Compare inventory turns, ROA, and ROE for Apple and their
competitor Samsung, at the time the case was written. Briefly
provide the computation for each one (state which year(s) you
used). Look at the big picture-- how do they compare?
EXHIBIT 11: APPLE'S HISTORICAL FINANCIAL INFORMATION (SELECTED) FY 2013 FY 2012 FY 2011 9/28/2013 9/29/2012 9/24/2011 Net sales 170.910.000 156.508,000 108.249.000 Cost of sales 106,606,000 87,846,000 64,431,000 Gross margin 64,304,000 68,662,000 43,818,000 Research & development expense L 4.475.000 3.381.000 2.429.000...
Most questions answered within 3 hours.
-
Bus lines can be separated into two generic types, dedicated and
multiplexed.
i. What is the...
asked 11 minutes ago -
This is 'Branding' course which is part of marketing.
1. As a brand manager of Nudie...
asked 32 minutes ago -
You are considering the purchase of a new stock. The stock is
forecasted to pay a...
asked 1 hour ago -
vector a has componets Ax and Ay, and makes an angle theta with
the y-axis. Select...
asked 1 hour ago -
What were the problems of the american frontier after 1763 and how
did the British address...
asked 2 hours ago -
Why
isn’t pentanol (CH3 CH2 CH2 CH2 CH2 OH) very soluble in
water?
asked 2 hours ago -
In preparing its bank reconciliation for the month of April
2018, Haskins, Inc. has available the...
asked 4 hours ago -
Your job is to do the following: build a Monster class as your
base class, along...
asked 4 hours ago -
Phosgene (COCl2) reacts with ammonia
(NH3), as shown in this reaction. If 1.2 grams of
COCl2...
asked 4 hours ago -
Wefald Company sold bonds with a face value of $675,000 for
$625,000. The bonds have a...
asked 4 hours ago -
Research predefined java packages. Select 2 packages and
describe what they provide. Explain briefly what type...
asked 5 hours ago -
A fair 9-sided die is tossed. Find P(4
or at least 5). That is, find the...
asked 5 hours ago