
Homework Answers


Add Answer to:
Compute the tak liabilities for each year along with tracking any NOL. The company's objective is...
2. Compute the tax liabilities for each year along with tracking any NOL. The company's objective...
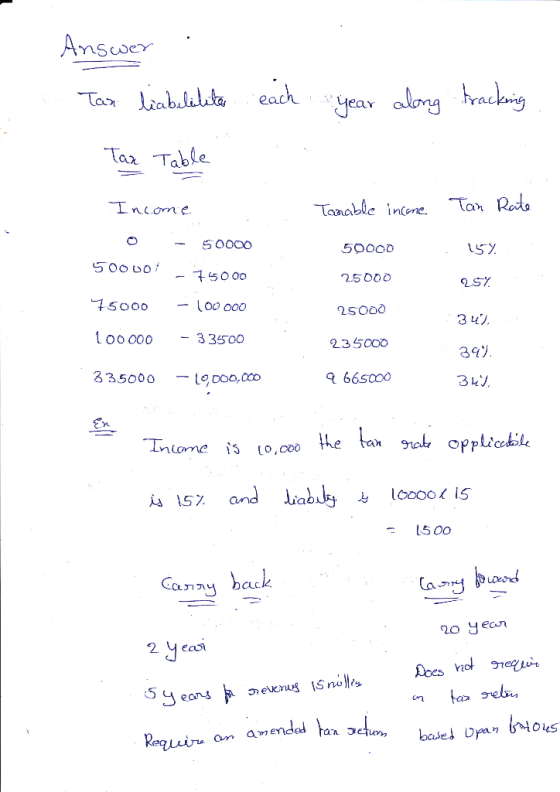
2. Compute the tax liabilities for each year along with tracking any NOL. The company's objective is to use the carryback and then the carryforward to ensure its tax liability is as small as possible These figures are for a company with yearly revenues of over $15 million Net Income/ Net Income/ a. (Loss) b. (Loss) 2001 20,000 2001 (25,000) 2002 12,000 2002 (1,000) 2003 (13,000) 2003 4,000 2004 4,000 2004 6,000...
How do they get the last number with Excel? It always looks on Excel like this: Year Accidents 2001 197 #NV 2002 235 197,00 2003 197 212,20 2004 189 206,12 2005 209 199,27 2006 232 20...
 How do they get the last number with Excel? It always looks on
Excel like this:
Year
Accidents
2001
197
#NV
2002
235
197,00
2003
197
212,20
2004
189
206,12
2005
209
199,27
2006
232
203,16
2007
211
214,70
2008
204
213,22
How do I get the 209.53? (I always go on Data Analysis -
Exponential Smoothing - Damping Factor 0.6) However I never get the
last number...can you maybe help me how to solve it?
The following data represent...
How do they get the last number with Excel? It always looks on
Excel like this:
Year
Accidents
2001
197
#NV
2002
235
197,00
2003
197
212,20
2004
189
206,12
2005
209
199,27
2006
232
203,16
2007
211
214,70
2008
204
213,22
How do I get the 209.53? (I always go on Data Analysis -
Exponential Smoothing - Damping Factor 0.6) However I never get the
last number...can you maybe help me how to solve it?
The following data represent...
Here are the number of domestic flights flown in each year from 2000 to 2016 Year...
Here are the number of domestic flights flown in each year from 2000 to 2016 Year Flights 2000 7,905,617 2001 7,626,312 2002 8,085,083 2003 9,458,818 2004 9,968,047 2005 10,038,373 2006 9,712,750 2007 9,839,578 2008 9,378,227 2009 8,768,938 2010 8,702,365 2011 8,649,087 2012 8,446,201 2013 8,323,938 2014 8,107,802 2015 8,061,158 2016 4,036,068 In turns out that the value reported for 2016 was only for the period January to June. What should we have done with that point?
ncio.wwnortm e Page(s) 444-445 14.1. Exactly what happened during the Great Recession and the Great Depression?...
 ncio.wwnortm e Page(s) 444-445 14.1. Exactly what happened during the Great Recession and the Great Depression? Refer to the figure below and fill in the blanks to complete the following passage. Consumer 110 Sentiment Inder 100 Great Recession 8 3 2001 2002 2003 2004 2005 2006 2007 2008 2009 2010 2011 2012 Drag word(s) below to fill in the blank(s) in the passage. Economists use the which is graphed above, as a measure of consumers' confidence in their financial future....
Name Paper Assignment No. 3 Chapter 4 Due Tuesday, February 5, 2019 Year Sales Net Income...
 Name Paper Assignment No. 3 Chapter 4 Due Tuesday, February 5, 2019 Year Sales Net Income 2000 55.0 7.7 2001 594 10.1 2002 71.3 7. 003 95.0 18.1 2004 114.0 16.0 2005 164.2 18.1 2006 131.4 13.1 2007 1971 29.6 2008 236.5 26.0 2009 312.2 56.2 2010 374.6 45.0 2011 408,7 45.0 2012 392.3 58.8 2012 588.5 58.9 2014 706.2 77.7 2015 762.6 99.1 2016 915.2 91.5 2017 1464.3 175.7 2018 11714 152.3 For cach variable, calculate the following statistics...
Compare inventory turns, ROA, and ROE for Apple and their competitor Samsung, at the time the...
 Compare inventory turns, ROA, and ROE for Apple and their
competitor Samsung, at the time the case was written. Briefly
provide the computation for each one (state which year(s) you
used). Look at the big picture-- how do they compare?
EXHIBIT 11: APPLE'S HISTORICAL FINANCIAL INFORMATION (SELECTED) FY 2013 FY 2012 FY 2011 9/28/2013 9/29/2012 9/24/2011 Net sales 170.910.000 156.508,000 108.249.000 Cost of sales 106,606,000 87,846,000 64,431,000 Gross margin 64,304,000 68,662,000 43,818,000 Research & development expense L 4.475.000 3.381.000 2.429.000...
Compare inventory turns, ROA, and ROE for Apple and their
competitor Samsung, at the time the case was written. Briefly
provide the computation for each one (state which year(s) you
used). Look at the big picture-- how do they compare?
EXHIBIT 11: APPLE'S HISTORICAL FINANCIAL INFORMATION (SELECTED) FY 2013 FY 2012 FY 2011 9/28/2013 9/29/2012 9/24/2011 Net sales 170.910.000 156.508,000 108.249.000 Cost of sales 106,606,000 87,846,000 64,431,000 Gross margin 64,304,000 68,662,000 43,818,000 Research & development expense L 4.475.000 3.381.000 2.429.000...
B. Francis established Computer Wizards during November of this year. The accountant prepared the following chart...
B. Francis established Computer Wizards during November of this year. The accountant prepared the following chart of accounts: Assets Revenue Cash Income from Services Supplies Computer Software Expenses Office Equipment Wages Expense Neon Sign Rent Expense Advertising Expense Liabilities Utilities Expense Accounts Payable Miscellaneous Expense Owner's Equity B. Francis, Capital B. Francis, Drawing The following transactions occurred during the month: Francis deposited $59,000 in a bank account in the name of the business. Paid the rent for the current month,...
Simon is an Australian resident taxpayer who has undertaken the following transactions during the tax year...
Simon is an Australian resident taxpayer who has undertaken the following transactions during the tax year ending 30 June 2019. Item number Transaction Particulars 1 Sold car Purchased on 1 March 2010 for $30,000. Sold on 20 April 2019 for $12,000 2 Sold painting Purchased on 1 January 2008 for $600. Sold on 3 February 2019 for $6,000 3 Shares sold in C Pty Ltd Purchased on 14 April 2013 for $10,000 and sold on 15 May 2019 for $20,000....
Simon is an Australian resident taxpayer who has undertaken the following transactions during the tax year ending 30 June 2019. Item number Transaction Particulars 1 Sold car Purchased...
Simon is an Australian resident taxpayer who has undertaken the following transactions during the tax year ending 30 June 2019. Item number Transaction Particulars 1 Sold car Purchased on 1 March 2010 for $30,000. Sold on 20 April 2019 for $12,000 2 Sold painting Purchased on 1 January 2008 for $600. Sold on 3 February 2019 for $6,000 3 Shares sold in C Pty Ltd Purchased on 14 April 2013 for $10,000 and sold on 15 May 2019 for $20,000....
1. Exercise 5.1 The forecasting staff for the Prizer Corporation has developed a model to predict...
 1. Exercise 5.1 The forecasting staff for the Prizer Corporation has developed a model to predict sales of its air-cushioned-ride snowmobiles. The model specifies that sales, S, vary jointly with disposable personal income, Y, and the population between ages 15 and 40,Z, and inversely with the price of the snowmobiles, P. Based on past data, the best estimate of this relationship is: where k has been estimated (from past data) to equal 100 If Y $13,000, Z- $1,200, and P...
 How do they get the last number with Excel? It always looks on
Excel like this:
Year
Accidents
2001
197
#NV
2002
235
197,00
2003
197
212,20
2004
189
206,12
2005
209
199,27
2006
232
203,16
2007
211
214,70
2008
204
213,22
How do I get the 209.53? (I always go on Data Analysis -
Exponential Smoothing - Damping Factor 0.6) However I never get the
last number...can you maybe help me how to solve it?
The following data represent...
How do they get the last number with Excel? It always looks on
Excel like this:
Year
Accidents
2001
197
#NV
2002
235
197,00
2003
197
212,20
2004
189
206,12
2005
209
199,27
2006
232
203,16
2007
211
214,70
2008
204
213,22
How do I get the 209.53? (I always go on Data Analysis -
Exponential Smoothing - Damping Factor 0.6) However I never get the
last number...can you maybe help me how to solve it?
The following data represent...
 ncio.wwnortm e Page(s) 444-445 14.1. Exactly what happened during the Great Recession and the Great Depression? Refer to the figure below and fill in the blanks to complete the following passage. Consumer 110 Sentiment Inder 100 Great Recession 8 3 2001 2002 2003 2004 2005 2006 2007 2008 2009 2010 2011 2012 Drag word(s) below to fill in the blank(s) in the passage. Economists use the which is graphed above, as a measure of consumers' confidence in their financial future....
 Name Paper Assignment No. 3 Chapter 4 Due Tuesday, February 5, 2019 Year Sales Net Income 2000 55.0 7.7 2001 594 10.1 2002 71.3 7. 003 95.0 18.1 2004 114.0 16.0 2005 164.2 18.1 2006 131.4 13.1 2007 1971 29.6 2008 236.5 26.0 2009 312.2 56.2 2010 374.6 45.0 2011 408,7 45.0 2012 392.3 58.8 2012 588.5 58.9 2014 706.2 77.7 2015 762.6 99.1 2016 915.2 91.5 2017 1464.3 175.7 2018 11714 152.3 For cach variable, calculate the following statistics...
 Compare inventory turns, ROA, and ROE for Apple and their
competitor Samsung, at the time the case was written. Briefly
provide the computation for each one (state which year(s) you
used). Look at the big picture-- how do they compare?
EXHIBIT 11: APPLE'S HISTORICAL FINANCIAL INFORMATION (SELECTED) FY 2013 FY 2012 FY 2011 9/28/2013 9/29/2012 9/24/2011 Net sales 170.910.000 156.508,000 108.249.000 Cost of sales 106,606,000 87,846,000 64,431,000 Gross margin 64,304,000 68,662,000 43,818,000 Research & development expense L 4.475.000 3.381.000 2.429.000...
Compare inventory turns, ROA, and ROE for Apple and their
competitor Samsung, at the time the case was written. Briefly
provide the computation for each one (state which year(s) you
used). Look at the big picture-- how do they compare?
EXHIBIT 11: APPLE'S HISTORICAL FINANCIAL INFORMATION (SELECTED) FY 2013 FY 2012 FY 2011 9/28/2013 9/29/2012 9/24/2011 Net sales 170.910.000 156.508,000 108.249.000 Cost of sales 106,606,000 87,846,000 64,431,000 Gross margin 64,304,000 68,662,000 43,818,000 Research & development expense L 4.475.000 3.381.000 2.429.000...
 1. Exercise 5.1 The forecasting staff for the Prizer Corporation has developed a model to predict sales of its air-cushioned-ride snowmobiles. The model specifies that sales, S, vary jointly with disposable personal income, Y, and the population between ages 15 and 40,Z, and inversely with the price of the snowmobiles, P. Based on past data, the best estimate of this relationship is: where k has been estimated (from past data) to equal 100 If Y $13,000, Z- $1,200, and P...
Most questions answered within 3 hours.
-
A small body of mass m performs small oscillations sliding (no
rolling) along the bottom of...
asked 1 minute ago -
The electric field in the region between two oppositely charged,
parallel, conducting plates has a magnitude...
asked 1 minute ago -
A simple random sample was taken to test the claim that the
population mean is no...
asked 1 hour ago -
A set of length measurements are obtained with the values 165.6
± 0.3, 165.1± 0.4,166.4± 1.0,...
asked 1 hour ago -
1. Which of the following is true about unconscionable
contracts?
a. A term is substantially unconscionable...
asked 15 minutes ago -
A company is interested in estimating the costs of lunch
in their cafeteria. After surveying employees,...
asked 47 minutes ago -
A 0.2m diameter ball with an initial velocity of 8m/s rolls up a
hill without slipping....
asked 30 minutes ago -
I want to redraft the solution, using other words , use your own
words don't copy...
asked 19 minutes ago -
Hyundai Motors is considering threesites—A, B,C —at which to
locate a factory to build its new-model...
asked 21 minutes ago -
Learning Outcomes:
Upon the successful completion of this module, you should
understand the following concepts:
Strategic...
asked 22 minutes ago -
Identify four of the five major types of organizations within
the federal bureaucracy, and give examples...
asked 30 minutes ago -
The following data have been obtained
for the effect of solvent composition on the solubility of...
asked 31 minutes ago