
Homework Answers
Add Answer to:
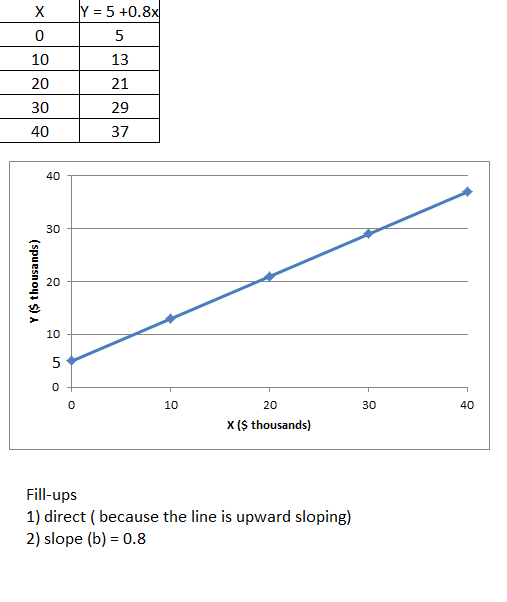
(10) Problem: Graph of a Linear Equation X = one family's annual income (measured in thousands...
A student measured the following data for the solubility of a compound in water at various...
 A student measured the following data for the solubility of a compound in water at various temperatures. The student prepared a graph of these data. Choose all the incorrect features of this graph. 40 30 Solubility Temperature 12.4 20 20.2 23 26.0 32 29.6 40 35.4 43 39.3 52 20 10 Temperaturg 100 1201 20 40 60 80 The points should not be connected by lines. A "best fit" line should be used. There should be open circles instead of...
Procedure Use the following sets of data and work with each one. The equation for a...
 Procedure Use the following sets of data and work with each one. The equation for a linear graph is y mx+b, where m is the slope and b is the y-intercept. DATA SET 1: Fahrenheit-vs- Celsius Fahrenheit Celsius 32 68 104 140 176 0 20 40 60 80 1. Using Data Set 1 above, graph Fahrenheit (y) -vs- Celsius (x), using the scatterplot function in excel, or another graphing software. Make sure you label the axes. Fahrenheit should be on...
Price and cost (thousands of dollars per student per yees) The graph shows the demand for...
 Price and cost (thousands of dollars per student per yees) The graph shows the demand for college education. The marginal cost of this education is $5,000 a year and the marginal external benefit is $1,000 per student per year. All colleges are private and the government offers vouchers to those who enroll at a college. Draw the marginal social benefit curve. Label it MSB. Draw an arrow at the efficient number of students that shows the value of the voucher...
A sociologist is interested in the relation between x = number of job changes and γ = annual salary (in thousands of dollars) for people living in the Nashville area. A random sample of 10 people emp...
 A sociologist is interested in the relation between x = number of job changes and γ = annual salary (in thousands of dollars) for people living in the Nashville area. A random sample of 10 people employed in Nashville provided the following information. 9 10 10 3 34 36 32 32 32 3843 37 40 33 5 76 x (number of job changes) Y (Salary in $1000 In this setting we have Σχ = 62, Ху-357, ΣΧ2-462, Xy2-12,875, and ΣΧγ...
The graph shows the marginal private benefit from design school education. The marginal cost of this...
 The graph shows the marginal private benefit from design school education. The marginal cost of this education is a constant $12,000 a year. The marginal external benefit from a design school education is $4,000 per student per year. Suppose the government decides to provide public design schools. Price and cost (thousands of dollars) 28- Draw the marginal cost curve. Label it MC. Draw the marginal social benefit curve. Label it MSB. Draw a line that shows the tuition that schools...
10 pts The regression equation for the given data points is provided. Graph the regression equation...
 10 pts The regression equation for the given data points is provided. Graph the regression equation and the data points. x 10 14 20 6 6 14 16 24 32 36 y 19 23 29 12 17 23 25 33 37 5 A = 9.3 +0.95% 40 30 20+ 10+ 4 8 12 16 20 24 28 32 36 40 %
Given an income equation, $150 = ($10 x wine) + ($5 x crackers) and utility function:...
Given an income equation, $150 = ($10 x wine) + ($5 x crackers) and utility function: U = (W.75C.25) 1. Calculate the indifference curve at the optimal levels of consumption of W and C and graph. 2. Economically speaking, what is going on at that point? 3. Using the numbers from above, find the consumer equilibrium condition or rule and explain. 4. Put wine on the x axis and crackers on the y axis and find both intercept points and...
3. Using the midpoint method The following graph shows two known points (X and Y) on...
 3. Using the midpoint method The following graph shows two known points (X and Y) on a demand curve for tomatoes, PRICE (Dollars per pound) Demand O + 0 + 10 20 30 40 50 60 70 80 90 QUANTITY (Thousands of pounds of tomatoes) 100 , which suggests According to the midpoint method, the price elasticity of demand for tomatoes between point X and point Y is approximately that the demand for tomatoes is between points X and Y.
To see if there is a linear relation between the length of the rheostat and the...
 To see if there is a linear relation between the length of the
rheostat and the number of ohms, use Excel to draw a graph of
reading on the DMM (Ohms) (on the y-axis) versus obstacle (on the
?-axis). Add a linear trend-line. Display the equation of the
trend-line and the value of R2
What value of R2 do you get for this graph and what
is the significance of this number?
What can you conclude about the concept of...
To see if there is a linear relation between the length of the
rheostat and the number of ohms, use Excel to draw a graph of
reading on the DMM (Ohms) (on the y-axis) versus obstacle (on the
?-axis). Add a linear trend-line. Display the equation of the
trend-line and the value of R2
What value of R2 do you get for this graph and what
is the significance of this number?
What can you conclude about the concept of...
Graph the following linear inequalities on the digital graph paper worksheet Problem 10. Show ALL your algebra steps that are required to determine the X and Y intercepts for both equations in the te...
 Graph the following linear inequalities on the digital graph paper worksheet Problem 10. Show ALL your algebra steps that are required to determine the X and Y intercepts for both equations in the text box. From the MS Excel ribbon > Insert> Shapes> Lines. Y coefficient 4 Line # X coefficient "RHS" 36 48 0 Use the text box for you answer. Solve algebraically, showing ALL steps, for the solution, or "intersection" of 1. Equation 1 and equation 2. 2....
 A student measured the following data for the solubility of a compound in water at various temperatures. The student prepared a graph of these data. Choose all the incorrect features of this graph. 40 30 Solubility Temperature 12.4 20 20.2 23 26.0 32 29.6 40 35.4 43 39.3 52 20 10 Temperaturg 100 1201 20 40 60 80 The points should not be connected by lines. A "best fit" line should be used. There should be open circles instead of...
 Procedure Use the following sets of data and work with each one. The equation for a linear graph is y mx+b, where m is the slope and b is the y-intercept. DATA SET 1: Fahrenheit-vs- Celsius Fahrenheit Celsius 32 68 104 140 176 0 20 40 60 80 1. Using Data Set 1 above, graph Fahrenheit (y) -vs- Celsius (x), using the scatterplot function in excel, or another graphing software. Make sure you label the axes. Fahrenheit should be on...
 Price and cost (thousands of dollars per student per yees) The graph shows the demand for college education. The marginal cost of this education is $5,000 a year and the marginal external benefit is $1,000 per student per year. All colleges are private and the government offers vouchers to those who enroll at a college. Draw the marginal social benefit curve. Label it MSB. Draw an arrow at the efficient number of students that shows the value of the voucher...
 A sociologist is interested in the relation between x = number of job changes and γ = annual salary (in thousands of dollars) for people living in the Nashville area. A random sample of 10 people employed in Nashville provided the following information. 9 10 10 3 34 36 32 32 32 3843 37 40 33 5 76 x (number of job changes) Y (Salary in $1000 In this setting we have Σχ = 62, Ху-357, ΣΧ2-462, Xy2-12,875, and ΣΧγ...
 The graph shows the marginal private benefit from design school education. The marginal cost of this education is a constant $12,000 a year. The marginal external benefit from a design school education is $4,000 per student per year. Suppose the government decides to provide public design schools. Price and cost (thousands of dollars) 28- Draw the marginal cost curve. Label it MC. Draw the marginal social benefit curve. Label it MSB. Draw a line that shows the tuition that schools...
 10 pts The regression equation for the given data points is provided. Graph the regression equation and the data points. x 10 14 20 6 6 14 16 24 32 36 y 19 23 29 12 17 23 25 33 37 5 A = 9.3 +0.95% 40 30 20+ 10+ 4 8 12 16 20 24 28 32 36 40 %
 3. Using the midpoint method The following graph shows two known points (X and Y) on a demand curve for tomatoes, PRICE (Dollars per pound) Demand O + 0 + 10 20 30 40 50 60 70 80 90 QUANTITY (Thousands of pounds of tomatoes) 100 , which suggests According to the midpoint method, the price elasticity of demand for tomatoes between point X and point Y is approximately that the demand for tomatoes is between points X and Y.
 To see if there is a linear relation between the length of the
rheostat and the number of ohms, use Excel to draw a graph of
reading on the DMM (Ohms) (on the y-axis) versus obstacle (on the
?-axis). Add a linear trend-line. Display the equation of the
trend-line and the value of R2
What value of R2 do you get for this graph and what
is the significance of this number?
What can you conclude about the concept of...
To see if there is a linear relation between the length of the
rheostat and the number of ohms, use Excel to draw a graph of
reading on the DMM (Ohms) (on the y-axis) versus obstacle (on the
?-axis). Add a linear trend-line. Display the equation of the
trend-line and the value of R2
What value of R2 do you get for this graph and what
is the significance of this number?
What can you conclude about the concept of...
 Graph the following linear inequalities on the digital graph paper worksheet Problem 10. Show ALL your algebra steps that are required to determine the X and Y intercepts for both equations in the text box. From the MS Excel ribbon > Insert> Shapes> Lines. Y coefficient 4 Line # X coefficient "RHS" 36 48 0 Use the text box for you answer. Solve algebraically, showing ALL steps, for the solution, or "intersection" of 1. Equation 1 and equation 2. 2....
Most questions answered within 3 hours.
-
An entomologist discovers a dung beetle rolling a ball of dung
along the ground, and decides...
asked 39 minutes ago -
Humans have used horses for transportation for millions of
years. Therefore, they will use horses for...
asked 2 hours ago -
The following are the Jensen Corporation's unit costs of making
and selling an item at a...
asked 3 hours ago -
Does direct Medicare reimbursement of Advanced practice nurses
increase access to their services?
asked 3 hours ago -
List and explain why a company would choose to use a
published
compensation survey vs. creating...
asked 4 hours ago -
A discrete random variable X can take values from 1 to 10. Find
the variance of...
asked 4 hours ago -
The primary financial goal of a corporation is to maximize:
shareholders wealth.
earnings per share.
stock...
asked 4 hours ago -
determine whether the vectors u=(1,2,3,), v=(-2,1,0) and
w=(1,0,1) are linearly dependent or independent.
asked 4 hours ago -
python
Define a function called print_values which takes a dictionary
object as a parameter. The function...
asked 5 hours ago -
In Chapter 1 you created a program named Triangle in
which you displayed a seven-line triangle...
asked 5 hours ago -
Research question: What are the differences between separately
stated and non separately stated transactions in an...
asked 5 hours ago -
By using Arduino write a code that connects two LEDs to two
push-buttons. Each button controls...
asked 6 hours ago