
Homework Answers
b)
Histogram of Age for Males and Females

c)
Stem and Leaf Plots
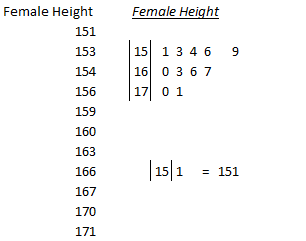

From the above stem and leaf plots we can conclude that the mean height of females is less than males.
d)
We calculate the frequencies of Both Males and Females heights and then plot the below histograms.
|
Range |
Females Freq |
|
151-160 |
6 |
|
161-171 |
5 |
|
Range |
Males Freq |
|
167-176 |
4 |
|
177-186 |
5 |


Add Answer to:
I
need help with 3b,3c,3d
This exercise also gives you practice with the ideas of Unit...
Need 3b,3c,3d This exercise also gives you practice with the ideas of Unit 1, Sections 4...
 Need 3b,3c,3d
This exercise also gives you practice with the ideas of Unit 1, Sections 4 ("Summ for Qualitative Data") and 5 ("Graphical Summaries for Quantitative Data")"Data recorded on the age in years and height in cm of 20 high school students in a classroom. Females Males Age Height Age Height 170 154 160 15 15 16 15 15 15 16 16 15 15 16 156 153 166 163 167 151 15 16 16 15 15 15 15 14 15...
Need 3b,3c,3d
This exercise also gives you practice with the ideas of Unit 1, Sections 4 ("Summ for Qualitative Data") and 5 ("Graphical Summaries for Quantitative Data")"Data recorded on the age in years and height in cm of 20 high school students in a classroom. Females Males Age Height Age Height 170 154 160 15 15 16 15 15 15 16 16 15 15 16 156 153 166 163 167 151 15 16 16 15 15 15 15 14 15...
This exercise gives you practice with the ideas of Unit 1, Sections 4 ("Summaries for Qualitative...
 This exercise gives you practice with the ideas of Unit 1, Sections 4 ("Summaries for Qualitative Data") and 5 ("Graphical Summaries for Quantitative Data") Using the data below (source: Daniel, 6 edition page 30, problem 2.3.5), 7 10 12 4 8 7 3 8 5 12 11 381113 104 8 13 17 17 34 5 5 3 1 17 10 47 7 118 2a. By hand, construct a stem and leaf display. 2b. By hand, construct a frequency table with...
I need 3b and 3c Cicrise gives you practice putting it all together The following table...
 I need 3b and 3c
Cicrise gives you practice putting it all together The following table shows the age distribution of cases of a certain disease reported during a year in a particular state. Age Number of Cases 5-14 15-24 25-34 35-44 45-54 55-64 10 20 TOTAL 75 3a. Construct a frequency table with columns for class endpoints, class midpoint, frequency, relative frequency, cumulative frequency, and cumulative relative frequency 3b. Construct a cumulative relative frequency plot of the data. Use...
I need 3b and 3c
Cicrise gives you practice putting it all together The following table shows the age distribution of cases of a certain disease reported during a year in a particular state. Age Number of Cases 5-14 15-24 25-34 35-44 45-54 55-64 10 20 TOTAL 75 3a. Construct a frequency table with columns for class endpoints, class midpoint, frequency, relative frequency, cumulative frequency, and cumulative relative frequency 3b. Construct a cumulative relative frequency plot of the data. Use...
 Need 3b,3c,3d
This exercise also gives you practice with the ideas of Unit 1, Sections 4 ("Summ for Qualitative Data") and 5 ("Graphical Summaries for Quantitative Data")"Data recorded on the age in years and height in cm of 20 high school students in a classroom. Females Males Age Height Age Height 170 154 160 15 15 16 15 15 15 16 16 15 15 16 156 153 166 163 167 151 15 16 16 15 15 15 15 14 15...
Need 3b,3c,3d
This exercise also gives you practice with the ideas of Unit 1, Sections 4 ("Summ for Qualitative Data") and 5 ("Graphical Summaries for Quantitative Data")"Data recorded on the age in years and height in cm of 20 high school students in a classroom. Females Males Age Height Age Height 170 154 160 15 15 16 15 15 15 16 16 15 15 16 156 153 166 163 167 151 15 16 16 15 15 15 15 14 15...
 This exercise gives you practice with the ideas of Unit 1, Sections 4 ("Summaries for Qualitative Data") and 5 ("Graphical Summaries for Quantitative Data") Using the data below (source: Daniel, 6 edition page 30, problem 2.3.5), 7 10 12 4 8 7 3 8 5 12 11 381113 104 8 13 17 17 34 5 5 3 1 17 10 47 7 118 2a. By hand, construct a stem and leaf display. 2b. By hand, construct a frequency table with...
 I need 3b and 3c
Cicrise gives you practice putting it all together The following table shows the age distribution of cases of a certain disease reported during a year in a particular state. Age Number of Cases 5-14 15-24 25-34 35-44 45-54 55-64 10 20 TOTAL 75 3a. Construct a frequency table with columns for class endpoints, class midpoint, frequency, relative frequency, cumulative frequency, and cumulative relative frequency 3b. Construct a cumulative relative frequency plot of the data. Use...
I need 3b and 3c
Cicrise gives you practice putting it all together The following table shows the age distribution of cases of a certain disease reported during a year in a particular state. Age Number of Cases 5-14 15-24 25-34 35-44 45-54 55-64 10 20 TOTAL 75 3a. Construct a frequency table with columns for class endpoints, class midpoint, frequency, relative frequency, cumulative frequency, and cumulative relative frequency 3b. Construct a cumulative relative frequency plot of the data. Use...
Most questions answered within 3 hours.
-
In the Metric System, the basic unit of measurement for length
is ___
In the Metric...
asked 1 minute ago -
A spatially uniform electric field varies in time according
to E = Eo + 3000 t,...
asked 1 minute ago -
A sample of C3H8 has 1.60×1024 H atoms.
How many carbon atoms does the sample contain?...
asked 8 minutes ago -
Discuss the sales orders process module(s) in the Enterprise
Resource Planning system. How does it contribute...
asked 10 minutes ago -
The position in an object as a function of time is given as ?
(?) =...
asked 11 minutes ago -
Design a class for python named PersonData with the following
member variables:
lastName
firstName
address
city...
asked 24 minutes ago -
How does use of the risk/need/responsivity model impact
effective rehabilitation services?
asked 28 minutes ago -
Your rich uncle has just given you a high school graduation
present of $900,000. The present,...
asked 31 minutes ago -
1=Write a program in C to get 16-bit data from Port-D and send
it to ports...
asked 30 minutes ago -
Calculate Ecell for the following reaction and conditions: 0.50
M Br2 (aq), 0.10 M Pb+2 (aq),...
asked 50 minutes ago -
There can be more than one correct answer.
Hypophysiotropic hormones:
A. released by the hypothalamus
B....
asked 56 minutes ago -
Scott Ruskin is the CEO of Decatur Materials. The company has
been struggling for the last...
asked 54 minutes ago