The state test scores for 12 randomly selected high school seniors are shown on the right....
The state test scores for 12 randomly selected high school seniors are shown on the right. Complete parts (a) through (c) below. Assume the population is normally distributed. 1422 1222 985 693 729 840 723 746 542 620 1450 941
Homework Answers
Solution:-
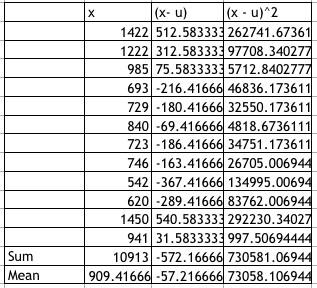
a) The sample mean is 909.417.
b) The sample standard deviation is 257.714.
c) 95% confidence interval for the population mean is C.I = ( 763.602, 1055.232).
C.I = 909.417 + 1.96*74.3956
C.I = 909.417 + 145.8154
C.I = ( 763.602, 1055.232)
Add Answer to:
The state test scores for 12 randomly selected high school
seniors are shown on the right....
The state test scores for 12 randomly selected high school seniors are shown on the right....
The state test scores for 12 randomly selected high school seniors are shown on the right. Complete parts (a) through (c) below. Assume the population is normally distributed. 1427 1225 989 700 720 839 729 740 542 620 1442 946 (a) Find the sample mean. x=
9 The state test scores for 12 randomly selected high school seniors are shown on the...
 9
The state test scores for 12 randomly selected high school seniors are shown on the right Complete parts (a) through (c) below Assume the population is normally distributed. 1422 691 722 622 1224 723 742 1443 987 835 550 943 (a) Find the sample mean x=(Round to one decimal place as needed.) (b) Find the sample standard deviation $=(Round to one decimal place as needed.) (c) Construct a 99% confidence interval for the population mean A 99% confidence interval...
9
The state test scores for 12 randomly selected high school seniors are shown on the right Complete parts (a) through (c) below Assume the population is normally distributed. 1422 691 722 622 1224 723 742 1443 987 835 550 943 (a) Find the sample mean x=(Round to one decimal place as needed.) (b) Find the sample standard deviation $=(Round to one decimal place as needed.) (c) Construct a 99% confidence interval for the population mean A 99% confidence interval...
The state test scores for 12 randomly selected high school seniors are shown on the right....
 The state test scores for 12 randomly selected high school seniors are shown on the right. Completo parts (a) through 1425 (c) below 697 720 Assume the population is normally distributed 628 1221 729 747 1446 980 837 546 946 (a) Find the sample mean (Round to one decimal place as needed.) (b) Find the sample standard deviation (Round to one decimal place as needed.) (c) Construct a 99% confidence interval for the population mean A 99% confidence interval for...
The state test scores for 12 randomly selected high school seniors are shown on 1424 the...
 The state test scores for 12 randomly selected high school seniors are shown on 1424 the right. Complete parts (a) through (C) below. 694 721 Assume the population is normally distributed. 630 1221 727 741 1440 981 831 542 940 (a) Find the sample mean. x = = 907.7 (Round to one decimal place as needed.) (b) Find the sample standard deviation. SE (Round to one decimal place as needed.)
The state test scores for 12 randomly selected high school seniors are shown on the right....
The state test scores for 12 randomly selected high school seniors are shown on the right. Complete parts (a) through (c) below. Assume the population is normally distributed. 1423 1222 989 695 726 837 724 745 545 622 1440 947 (a) Find the sample mean. x overbarxequals=909.6 (Round to one decimal place as needed.) (b) Find the sample standard deviation. sequals=303.4 (Round to one decimal place as needed.) (c) Construct a 99% confidence interval for the population mean muμ. A...
0 The state test scores for 12 randomly selected high school seniors are shown on the...
 0 The state test scores for 12 randomly selected high school seniors are shown on the right Complete parts (a) through (c) below. Assume the population is normally distributed 1420 697 721 622 1225 722 745 1445 984 834 542 943 (a) Find the sample mean. (Round to one decimal place as needed.) (b) Find the sample standard deviation. (Round to one decimal place as needed.) (c) Construct a 99% confidence interval for the population mean . A 99% confidence...
981 The state test scores for 12 randomly selected high school seniors are shown on the...
 981 The state test scores for 12 randomly selected high school seniors are shown on the right. Complete parts (a) through 1424 (c) below. 694 Assume the population is normally distributed. 721 630 1221 727 741 1440 831 542 940 a) Find the sample mean. x = 907.7 (Round to one decimal place as needed.) (b) Find the sample standard deviation. S = 303.3 (Round to one decimal place as needed.) c) Construct a 90% confidence interval for the population...
The state test scores for 12randomly selected high school seniors are shown on the right. Assume...
The state test scores for 12randomly selected high school seniors are shown on the right. Assume the population is normally distributed. 1426 1227 984 695 723 830 730 744 544 624 1440 950 A-Find the sample mean B-Find sample standard deviation Round to one decimal place as needed.
986 The state test scores for 12 randomly selected high school seniors are shown on the...
 986 The state test scores for 12 randomly selected high school seniors are shown on the right. Complete parts (a) through (c) below. Assume the population is normally distributed. 1421 700 722 621 1228 730 747 1444 837 550 942 (a) Find the sample mean. x = 910.7 (Round to one decimal place as needed.) (b) Find the sample standard deviation. (Round to one decimal place as needed.) SE
 9
The state test scores for 12 randomly selected high school seniors are shown on the right Complete parts (a) through (c) below Assume the population is normally distributed. 1422 691 722 622 1224 723 742 1443 987 835 550 943 (a) Find the sample mean x=(Round to one decimal place as needed.) (b) Find the sample standard deviation $=(Round to one decimal place as needed.) (c) Construct a 99% confidence interval for the population mean A 99% confidence interval...
9
The state test scores for 12 randomly selected high school seniors are shown on the right Complete parts (a) through (c) below Assume the population is normally distributed. 1422 691 722 622 1224 723 742 1443 987 835 550 943 (a) Find the sample mean x=(Round to one decimal place as needed.) (b) Find the sample standard deviation $=(Round to one decimal place as needed.) (c) Construct a 99% confidence interval for the population mean A 99% confidence interval...
 The state test scores for 12 randomly selected high school seniors are shown on the right. Completo parts (a) through 1425 (c) below 697 720 Assume the population is normally distributed 628 1221 729 747 1446 980 837 546 946 (a) Find the sample mean (Round to one decimal place as needed.) (b) Find the sample standard deviation (Round to one decimal place as needed.) (c) Construct a 99% confidence interval for the population mean A 99% confidence interval for...
 The state test scores for 12 randomly selected high school seniors are shown on 1424 the right. Complete parts (a) through (C) below. 694 721 Assume the population is normally distributed. 630 1221 727 741 1440 981 831 542 940 (a) Find the sample mean. x = = 907.7 (Round to one decimal place as needed.) (b) Find the sample standard deviation. SE (Round to one decimal place as needed.)
 0 The state test scores for 12 randomly selected high school seniors are shown on the right Complete parts (a) through (c) below. Assume the population is normally distributed 1420 697 721 622 1225 722 745 1445 984 834 542 943 (a) Find the sample mean. (Round to one decimal place as needed.) (b) Find the sample standard deviation. (Round to one decimal place as needed.) (c) Construct a 99% confidence interval for the population mean . A 99% confidence...
 981 The state test scores for 12 randomly selected high school seniors are shown on the right. Complete parts (a) through 1424 (c) below. 694 Assume the population is normally distributed. 721 630 1221 727 741 1440 831 542 940 a) Find the sample mean. x = 907.7 (Round to one decimal place as needed.) (b) Find the sample standard deviation. S = 303.3 (Round to one decimal place as needed.) c) Construct a 90% confidence interval for the population...
 981 The state test scores for 12 randomly selected high school seniors are shown on the right. Complete parts (a) through 1424 (c) below. 694 Assume the population is normally distributed. 721 630 1221 727 741 1440 831 542 940 a) Find the sample mean. x = 907.7 (Round to one decimal place as needed.) (b) Find the sample standard deviation. S = 303.3 (Round to one decimal place as needed.) c) Construct a 90% confidence interval for the population...
 986 The state test scores for 12 randomly selected high school seniors are shown on the right. Complete parts (a) through (c) below. Assume the population is normally distributed. 1421 700 722 621 1228 730 747 1444 837 550 942 (a) Find the sample mean. x = 910.7 (Round to one decimal place as needed.) (b) Find the sample standard deviation. (Round to one decimal place as needed.) SE
Most questions answered within 3 hours.
-
Derive the long wavelength limit of the Planck energy density
distribution
asked 12 minutes ago -
Phosphorous + bromine = phosphorous tribromide. If 35.0 g of
bromine are reacted and 27.9 grams...
asked 22 minutes ago -
Calculate the pH of each of the following solutions.
0.50 M HBr
3.1×10⁻⁴ M KOH
4.2×10⁻⁵...
asked 3 hours ago -
For the year ended December 31, Depot Max’s cost of merchandise
sold was $85,600. Inventory at the...
asked 3 hours ago -
Week 10 - Professional Memo Assignment
Professional Memo Assignment
Your mission for this week, should you...
asked 3 hours ago -
Write a Python program that stores the data for each
player on the team, and it...
asked 4 hours ago -
In
the last 3 months, mike never knows when he is going to get his
allowance...
asked 4 hours ago -
Is Ca(OH)2 a Bronsted base, Lewis base, or both? Why?
asked 4 hours ago -
1A- Why don’t voters complain about U.S. tariffs on imported
sugar?
Because sugar is only a...
asked 4 hours ago -
Cash Payback Period
Primera Banco is evaluating two capital investment proposals for
a drive-up ATM kiosk,...
asked 4 hours ago -
Create a button in Swift (Xcode) that will create a charge,
create a charge using Stripe's...
asked 4 hours ago -
The reaction rate of CO and NO2 in the reaction
CO(g) + NO2(g) → CO2(g) +...
asked 4 hours ago