
Homework Answers


Add Answer to:
The state test scores for 12 randomly selected high school seniors are shown on 1424 the...
981 The state test scores for 12 randomly selected high school seniors are shown on the...
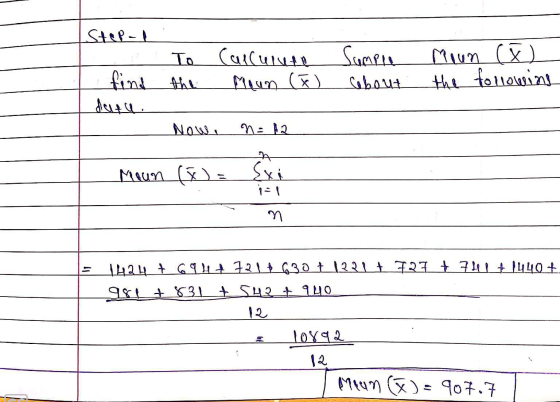
 981 The state test scores for 12 randomly selected high school seniors are shown on the right. Complete parts (a) through 1424 (c) below. 694 Assume the population is normally distributed. 721 630 1221 727 741 1440 831 542 940 a) Find the sample mean. x = 907.7 (Round to one decimal place as needed.) (b) Find the sample standard deviation. S = 303.3 (Round to one decimal place as needed.) c) Construct a 90% confidence interval for the population...
981 The state test scores for 12 randomly selected high school seniors are shown on the...
 981 The state test scores for 12 randomly selected high school seniors are shown on the right. Complete parts (a) through 1424 (c) below. 694 Assume the population is normally distributed. 721 630 1221 727 741 1440 831 542 940 a) Find the sample mean. x = 907.7 (Round to one decimal place as needed.) (b) Find the sample standard deviation. S = 303.3 (Round to one decimal place as needed.) c) Construct a 90% confidence interval for the population...
989 The state test scores for 12 randomly selected high school seniors are shown on the...
 989 The state test scores for 12 randomly selected high school seniors are shown on the right. Complete parts (a) through (c) below. Assume the population is normally distributed. 1424 695 725 623 1221 721 745 1442 837 544 947 (a) Find the sample mean. X= (Round to one decimal place as needed.) (b) Find the sample standard deviation. s= (Round to one decimal place as needed.) (c) Construct a 95% confidence interval for the population mean H. A 95%...
0 The state test scores for 12 randomly selected high school seniors are shown on the...
 0 The state test scores for 12 randomly selected high school seniors are shown on the right Complete parts (a) through (c) below. Assume the population is normally distributed 1420 697 721 622 1225 722 745 1445 984 834 542 943 (a) Find the sample mean. (Round to one decimal place as needed.) (b) Find the sample standard deviation. (Round to one decimal place as needed.) (c) Construct a 99% confidence interval for the population mean . A 99% confidence...
The state test scores for 12 randomly selected high school seniors are shown on the right....
 The state test scores for 12 randomly selected high school seniors are shown on the right. Completo parts (a) through 1425 (c) below 697 720 Assume the population is normally distributed 628 1221 729 747 1446 980 837 546 946 (a) Find the sample mean (Round to one decimal place as needed.) (b) Find the sample standard deviation (Round to one decimal place as needed.) (c) Construct a 99% confidence interval for the population mean A 99% confidence interval for...
986 The state test scores for 12 randomly selected high school seniors are shown on the...
 986 The state test scores for 12 randomly selected high school seniors are shown on the right. Complete parts (a) through (c) below. Assume the population is normally distributed. 1421 700 722 621 1228 730 747 1444 837 550 942 (a) Find the sample mean. x = 910.7 (Round to one decimal place as needed.) (b) Find the sample standard deviation. (Round to one decimal place as needed.) SE
The state test scores for 12 randomly selected high school seniors are shown on the right....
The state test scores for 12 randomly selected high school seniors are shown on the right. Complete parts (a) through (c) below. Assume the population is normally distributed. 1423 1222 989 695 726 837 724 745 545 622 1440 947 (a) Find the sample mean. x overbarxequals=909.6 (Round to one decimal place as needed.) (b) Find the sample standard deviation. sequals=303.4 (Round to one decimal place as needed.) (c) Construct a 99% confidence interval for the population mean muμ. A...
9 The state test scores for 12 randomly selected high school seniors are shown on the...
 9
The state test scores for 12 randomly selected high school seniors are shown on the right Complete parts (a) through (c) below Assume the population is normally distributed. 1422 691 722 622 1224 723 742 1443 987 835 550 943 (a) Find the sample mean x=(Round to one decimal place as needed.) (b) Find the sample standard deviation $=(Round to one decimal place as needed.) (c) Construct a 99% confidence interval for the population mean A 99% confidence interval...
9
The state test scores for 12 randomly selected high school seniors are shown on the right Complete parts (a) through (c) below Assume the population is normally distributed. 1422 691 722 622 1224 723 742 1443 987 835 550 943 (a) Find the sample mean x=(Round to one decimal place as needed.) (b) Find the sample standard deviation $=(Round to one decimal place as needed.) (c) Construct a 99% confidence interval for the population mean A 99% confidence interval...
E Question Help The state test scores for 12 randomly selected high school seniors are shown...
 E Question Help The state test scores for 12 randomly selected high school seniors are shown on the right. Complete parts (a) through (c) below. Assume the population is normally distributed. 1421 700 722 621 1228 730 747 1444 986 837 550 942 (a) Find the sample mean X = 910.7 (Round to one decimal place as needed.) (b) Find the sample standard deviation (Round to one decimal place as needed.)
The state test scores for 12randomly selected high school seniors are shown on the right. Assume...
The state test scores for 12randomly selected high school seniors are shown on the right. Assume the population is normally distributed. 1426 1227 984 695 723 830 730 744 544 624 1440 950 A-Find the sample mean B-Find sample standard deviation Round to one decimal place as needed.
 981 The state test scores for 12 randomly selected high school seniors are shown on the right. Complete parts (a) through 1424 (c) below. 694 Assume the population is normally distributed. 721 630 1221 727 741 1440 831 542 940 a) Find the sample mean. x = 907.7 (Round to one decimal place as needed.) (b) Find the sample standard deviation. S = 303.3 (Round to one decimal place as needed.) c) Construct a 90% confidence interval for the population...
 981 The state test scores for 12 randomly selected high school seniors are shown on the right. Complete parts (a) through 1424 (c) below. 694 Assume the population is normally distributed. 721 630 1221 727 741 1440 831 542 940 a) Find the sample mean. x = 907.7 (Round to one decimal place as needed.) (b) Find the sample standard deviation. S = 303.3 (Round to one decimal place as needed.) c) Construct a 90% confidence interval for the population...
 989 The state test scores for 12 randomly selected high school seniors are shown on the right. Complete parts (a) through (c) below. Assume the population is normally distributed. 1424 695 725 623 1221 721 745 1442 837 544 947 (a) Find the sample mean. X= (Round to one decimal place as needed.) (b) Find the sample standard deviation. s= (Round to one decimal place as needed.) (c) Construct a 95% confidence interval for the population mean H. A 95%...
 0 The state test scores for 12 randomly selected high school seniors are shown on the right Complete parts (a) through (c) below. Assume the population is normally distributed 1420 697 721 622 1225 722 745 1445 984 834 542 943 (a) Find the sample mean. (Round to one decimal place as needed.) (b) Find the sample standard deviation. (Round to one decimal place as needed.) (c) Construct a 99% confidence interval for the population mean . A 99% confidence...
 The state test scores for 12 randomly selected high school seniors are shown on the right. Completo parts (a) through 1425 (c) below 697 720 Assume the population is normally distributed 628 1221 729 747 1446 980 837 546 946 (a) Find the sample mean (Round to one decimal place as needed.) (b) Find the sample standard deviation (Round to one decimal place as needed.) (c) Construct a 99% confidence interval for the population mean A 99% confidence interval for...
 986 The state test scores for 12 randomly selected high school seniors are shown on the right. Complete parts (a) through (c) below. Assume the population is normally distributed. 1421 700 722 621 1228 730 747 1444 837 550 942 (a) Find the sample mean. x = 910.7 (Round to one decimal place as needed.) (b) Find the sample standard deviation. (Round to one decimal place as needed.) SE
 9
The state test scores for 12 randomly selected high school seniors are shown on the right Complete parts (a) through (c) below Assume the population is normally distributed. 1422 691 722 622 1224 723 742 1443 987 835 550 943 (a) Find the sample mean x=(Round to one decimal place as needed.) (b) Find the sample standard deviation $=(Round to one decimal place as needed.) (c) Construct a 99% confidence interval for the population mean A 99% confidence interval...
9
The state test scores for 12 randomly selected high school seniors are shown on the right Complete parts (a) through (c) below Assume the population is normally distributed. 1422 691 722 622 1224 723 742 1443 987 835 550 943 (a) Find the sample mean x=(Round to one decimal place as needed.) (b) Find the sample standard deviation $=(Round to one decimal place as needed.) (c) Construct a 99% confidence interval for the population mean A 99% confidence interval...
 E Question Help The state test scores for 12 randomly selected high school seniors are shown on the right. Complete parts (a) through (c) below. Assume the population is normally distributed. 1421 700 722 621 1228 730 747 1444 986 837 550 942 (a) Find the sample mean X = 910.7 (Round to one decimal place as needed.) (b) Find the sample standard deviation (Round to one decimal place as needed.)
Most questions answered within 3 hours.
-
describe conditions and outcomes of boiling
pasteurization and surfacing. which of these treatment can be
considered...
asked 53 seconds from now -
In a poll of 504 human resource professionals, 46.4% said that
body piercings and tattoos were...
asked 40 seconds from now -
AdrenalineAdrenaline
Sports Company makes snowboards, downhill skis, cross-country
skis, skateboards, surfboards, and in-line skates. The company...
asked 2 minutes ago -
Compare the Forfaiting and Factoring forms of export
financing
asked 4 minutes ago -
Europe in the 19th century was not dominated by:
a. the scientific quest
b. economic collectivism...
asked 13 minutes ago -
"The economic theory suggests that consumers will not shop at or
spend their money with a...
asked 17 minutes ago -
In your opinion, which provides the most benefit to an
organization, a budget or the budgeting...
asked 28 minutes ago -
What features are centralized in your web application by master
pages? How are master pages implemented...
asked 25 minutes ago -
Write the expression for the molecular wavefunction of (i) a
s-pz sigma bond and (ii) a...
asked 32 minutes ago -
It costs Crane Company $28 of variable costs and $10.00 of
allocated fixed costs to produce...
asked 46 minutes ago -
Explain the following basis of electron configuration i) the
electron affinity of S is +200kJ mol-1
asked 56 minutes ago -
Determine the pH of a 0.10 M
CH3NH3Cl solution.
(Kb
(CH3NH2) = 4.4 x 10⁻⁴)
2.18...
asked 1 hour ago