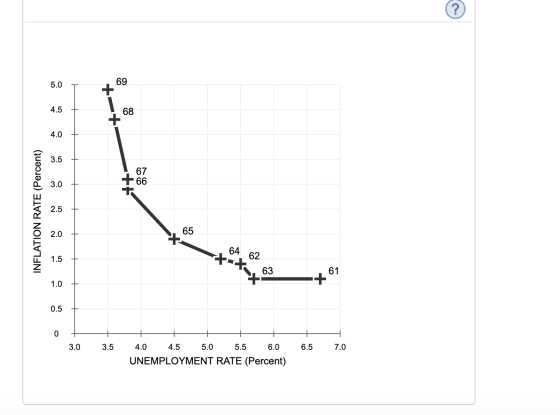
What happened to the inflation rate between the year when the unemployment rate was 5.5% and the year when it was 4.5%?
The inflation rate decreased by 2 percentage points.
The inflation rate decreased from 1.9% to 1.5%.
The inflation rate increased by 0.5 percentage points.
The inflation rate increased from 4% to 5%.
The points on the graph represent observations along the U.S. economy’s Phillips curve during the 1960s. If the inflation rate had been 4% during the 1960s, the unemployment rate would have had to go up by how many percentage points to reduce inflation to 3%?
1.2
0.2
2.8
2.0
Homework Answers
Q. Correct: B
As we know that as unemployment in a country decreases then the inflation rate goes up. The reason being a decrease in unemployment means that the economy is growing and economic indicators of growth are improving. This means that people are getting jobs and thus more spending and demand for goods and services in the economy. And the scenario is opposite if increase in unemployment is there. From the graph, we can infer that the increase in the unemployment rate from 4.5 to 5.5 % led to a decrease in the inflation rate from 1.9% to 1.5%.
Add Answer to:
What happened to the inflation rate between the year when the
unemployment rate was 5.5% and...
5.0 69 4.5 68 3.5 3.0 $ 2.5 2.0 67 65 64 63 61 1.0 0.5...
 5.0 69 4.5 68 3.5 3.0 $ 2.5 2.0 67 65 64 63 61 1.0 0.5 3.0 3.5 4.0 4.5 5.0 5.5 6.0 6.5 7.0 UNEMPLOYMENT RATE (Percent)
So let's say that this European Central Bank, the European Central Bank expects the natural unemployment rate to be 6 percent, and the actual unemployment rate is 5.5 percent. A.) Use the Phillips curve illustration to determine what happens to inflation
So let's say that this European Central Bank, the European Central Bank expects the natural unemployment rate to be 6 percent, and the actual unemployment rate is 5.5 percent.A.) Use the Phillips curve illustration to determine what happens to inflation and unemployment over a long period of time.B.) Assuming the expectation is the actual natural unemployment rate (5.5%), then if the government decides to increase government spending, please briefly explain and use the Phillips curve to illustrate.
Suppose you knew that the NAIRU (the non accelerating inflation rate of unemployment ) was 5.5...
Suppose you knew that the NAIRU (the non accelerating inflation rate of unemployment ) was 5.5 percent. The current unemployment rate is 5 percent. a) Is an increase in government spending more likely to increase output or increase prices? b) Now the unemployment rate rises to 6.5 percent , but the NAIRU stays the same. Is an increase in government more likely to increase output to to increase prices?
ECON 1150 ch 17
The following table shows selected data on unemployment and inflation in Canada between 1982 and 1986.YearUnemployment Rate (%)Inflation Rate (%)198211.010.8198312.05.9198411.34.3198510.64.019869.74.2The data for these five years have been plotted on the following graph for you. This graph will allow you to examine the relationship between unemployment and inflation during this period and solve the problems that follow.8.08.59.09.510.010.511.011.512.011.010.09.08.07.06.05.04.03.0INFLATION RATE (Percent)UNEMPLOYMENT RATE (Percent)The following graph shows the short-run Phillips curve for Canada in 1982. Shift the curve to illustrate what happened between 1982...
The following table shows the inflation rate and unemployment rate, both in percent, for the years...
 The following table shows the inflation rate and unemployment rate, both in percent, for the years 1981-2008. We will investigate some methods for predicting unemployment. 4.4 X (L1) y (L2) Year Inflation Unemployment 1981 8.9 7.6 1982 3.8 9.7 1983 3.8 9.6 1984 3.9 7.5 1985 3.8 7.2 1986 1.1 7 1987 6.2 1988 4.4 5.5 1989 4.6 5.3 1990 6.1 5.6 1991 3.1 6.8 1992 2.9 7.5 1993 2.7 6.9 1994 2.7 6.1 1995 2.5 5.6 1996 5.4 1997...
Indicate the correct answer and why, show work. Thank you The table shows the demand for...
 Indicate the correct answer and why, show work. Thank you
The table shows the demand for loanable funds schedule and the supply of loanable funds schedule when the government budget is balanced. If the government budget deficit is $1.0 trillion and the Ricardo-Barro effect occurs, what are the real interest rate and the Real Loanable funds Loanable funds interest rate demanded supplied quantity of investment? If the Ricardo-Barro effect occurs, and if the government budget deficit is $1.0 trillion, the...
Indicate the correct answer and why, show work. Thank you
The table shows the demand for loanable funds schedule and the supply of loanable funds schedule when the government budget is balanced. If the government budget deficit is $1.0 trillion and the Ricardo-Barro effect occurs, what are the real interest rate and the Real Loanable funds Loanable funds interest rate demanded supplied quantity of investment? If the Ricardo-Barro effect occurs, and if the government budget deficit is $1.0 trillion, the...
1. Is the Phillips curve a myth? Intertemporal tradeoff between inflation and unemployment After the World...
 1. Is the Phillips curve a myth? Intertemporal tradeoff between inflation and unemployment After the World War II, empirical economists noticed that, in many advanced economies, as unemployment fell, inflation tended to rise, and vice versa. The inverse relationship between unemployment and Inflation, was depicted as the Phillips curve, after William Phillips of the London School of Economics. In the 1950s and 1960s, the Phillips curve convinced many policy makers that they could use the relationship to pick acceptable levels...
3. What is the relationship between frictional unemployment and the natural rate of unemployment? Why does...
3. What is the relationship between frictional unemployment and the natural rate of unemployment? Why does frictional unemployment differ among different age groups in the population? If a society is aging overall, how will this affect unemployment? Be as thorough as possible. 2. Explain the benefits and drawbacks for unemployment insurance. Explain the benefits and drawbacks to the minimum wage. How do these policies affect work incentives? Be as thorough as possible. In 2012, the imaginary nation of Bovina had...
move at the same rate). Specify what you set aside on the shoulders; name all graphs and explain how you thought when d...
 move at the same rate). Specify what you set aside on the shoulders; name all graphs and explain how you thought when doing the graphs. (3p) 2. The public in the country has adaptive expectations. Now suppose the actual and the expected inflation are both eight percent and have been so for a long time. Explain what happens if inflation for any reason suddenly would increase permanently from eight to twelve percent (one-time increase equivalent to four percentage points). What...
38. According to the quantity theory of money, the inflation rate equals A) money supply minus...
 38. According to the quantity theory of money, the inflation rate equals A) money supply minus real GDP. 8) the growth rate of the money supply minus the growth rate of real GDP, C) real GDP minus the money supply. D) the growth rate of real GDP minus the growth rate of the money supply of money pre rate than reacop. A) money supporowing at a fidower rate the 39. The quantity theory of money predicts that in the long...
 5.0 69 4.5 68 3.5 3.0 $ 2.5 2.0 67 65 64 63 61 1.0 0.5 3.0 3.5 4.0 4.5 5.0 5.5 6.0 6.5 7.0 UNEMPLOYMENT RATE (Percent)
 The following table shows the inflation rate and unemployment rate, both in percent, for the years 1981-2008. We will investigate some methods for predicting unemployment. 4.4 X (L1) y (L2) Year Inflation Unemployment 1981 8.9 7.6 1982 3.8 9.7 1983 3.8 9.6 1984 3.9 7.5 1985 3.8 7.2 1986 1.1 7 1987 6.2 1988 4.4 5.5 1989 4.6 5.3 1990 6.1 5.6 1991 3.1 6.8 1992 2.9 7.5 1993 2.7 6.9 1994 2.7 6.1 1995 2.5 5.6 1996 5.4 1997...
 Indicate the correct answer and why, show work. Thank you
The table shows the demand for loanable funds schedule and the supply of loanable funds schedule when the government budget is balanced. If the government budget deficit is $1.0 trillion and the Ricardo-Barro effect occurs, what are the real interest rate and the Real Loanable funds Loanable funds interest rate demanded supplied quantity of investment? If the Ricardo-Barro effect occurs, and if the government budget deficit is $1.0 trillion, the...
Indicate the correct answer and why, show work. Thank you
The table shows the demand for loanable funds schedule and the supply of loanable funds schedule when the government budget is balanced. If the government budget deficit is $1.0 trillion and the Ricardo-Barro effect occurs, what are the real interest rate and the Real Loanable funds Loanable funds interest rate demanded supplied quantity of investment? If the Ricardo-Barro effect occurs, and if the government budget deficit is $1.0 trillion, the...
 1. Is the Phillips curve a myth? Intertemporal tradeoff between inflation and unemployment After the World War II, empirical economists noticed that, in many advanced economies, as unemployment fell, inflation tended to rise, and vice versa. The inverse relationship between unemployment and Inflation, was depicted as the Phillips curve, after William Phillips of the London School of Economics. In the 1950s and 1960s, the Phillips curve convinced many policy makers that they could use the relationship to pick acceptable levels...
 move at the same rate). Specify what you set aside on the shoulders; name all graphs and explain how you thought when doing the graphs. (3p) 2. The public in the country has adaptive expectations. Now suppose the actual and the expected inflation are both eight percent and have been so for a long time. Explain what happens if inflation for any reason suddenly would increase permanently from eight to twelve percent (one-time increase equivalent to four percentage points). What...
 38. According to the quantity theory of money, the inflation rate equals A) money supply minus real GDP. 8) the growth rate of the money supply minus the growth rate of real GDP, C) real GDP minus the money supply. D) the growth rate of real GDP minus the growth rate of the money supply of money pre rate than reacop. A) money supporowing at a fidower rate the 39. The quantity theory of money predicts that in the long...
Most questions answered within 3 hours.
-
Why
are large,multinational firms more likely to be concerned about
CSR?Why are lifestyle brands more susceptible...
asked 11 minutes ago -
answer the below qestion in term of marketing in “personal
selling steps”
( Question )
Consider...
asked 11 minutes ago -
Under normal use conditions, the Mean Time To Failure of a
heating coil can be modeled...
asked 13 minutes ago -
A student holds a ruler by one end (x=0 where the student holds
it). The student...
asked 13 minutes ago -
People are most likely to believe their ancestors play an active
role in their lives in...
asked 14 minutes ago -
A speeding car is traveling along a straight road with a
constant speed of 100 km/hour....
asked 31 minutes ago -
When 60.1 gg of calcium is reacted with nitrogen gas, 31.7 gg of
calcium nitride is...
asked 36 minutes ago -
The random variable X is exponentially distributed, where X
represents the time it takes for a...
asked 51 minutes ago -
a) Write a verilog module for 1:4 Demultiplexer using verilog
primitives.
b) Design 1-to-4 DEMUX using...
asked 46 minutes ago -
MATLAB
write a MATLAB function (1) output a third-order polynomial
function with the coefficients as the...
asked 58 minutes ago -
A z-score
communicates a raw score’s "relative standing"
under the normal curve in relation to:
asked 1 hour ago -
An object is vibrating on a spring with the following equation
of motion:
?=(30 ??)cos((2?)/(160)?)
a)...
asked 1 hour ago