ECON 1150 ch 17
The following table shows selected data on unemployment and inflation in Canada between 1982 and 1986.
| Year | Unemployment Rate (%) | Inflation Rate (%) |
|---|---|---|
| 1982 | 11.0 | 10.8 |
| 1983 | 12.0 | 5.9 |
| 1984 | 11.3 | 4.3 |
| 1985 | 10.6 | 4.0 |
| 1986 | 9.7 | 4.2 |
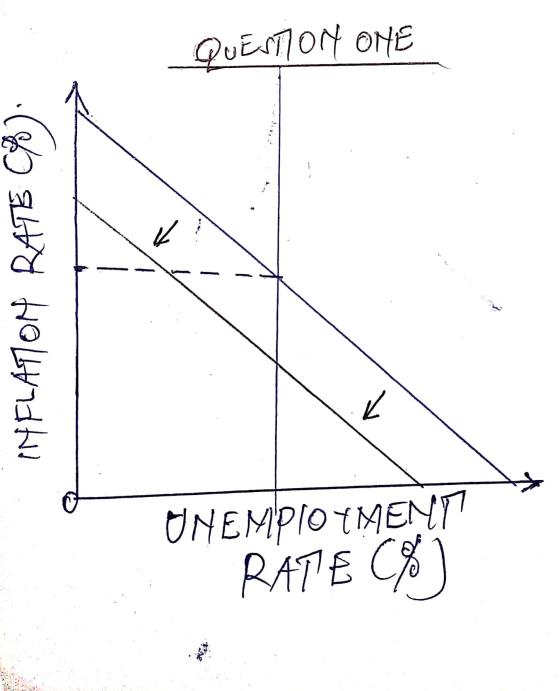
The data for these five years have been plotted on the following graph for you. This graph will allow you to examine the relationship between unemployment and inflation during this period and solve the problems that follow.
The following graph shows the short-run Phillips curve for Canada in 1982. Shift the curve to illustrate what happened between 1982 and 1986.
Which of the following statements best describes the relationship between inflation and unemployment in Canada during this time period?
The following graph shows the aggregate-demand and short-run aggregate-supply curves for Canada in 1982. Shift the aggregate-supply curve to approximate what happened between 1982 and 1986.
Homework Answers
Question 1)The period between 1982 and 1986 was associated by a fall in inflation rate and unemployment level.This caused a shift of the Phillips Curve to the left towards the origin implying lower employment and lower rate of inflation.
Therefore the correct answer is that The Phillips curve shifted after actual inflation was lower than expected.
Question 2)
The period between 1982 and 1986 saw a shift to the right of the Aggregate supply curve yielding more GDP at lower price level.

ECON 1150
In the year 2023, aggregate demand and aggregate supply in the fictional country of Gizmet are represented by the curves AD2023AD2023 and AS on the following graph. The price level is 102. The graph also shows two possible outcomes for 2024. The first potential aggregate-demand curve is given by the ADAADA curve, resulting in the outcome illustrated by point A. The second potential aggregate-demand curve is given by the ADBADB curve, resulting in the outcome illustrated by point B.0246810121416108107106105104103102101100PRICE LEVELOUTPUT (Trillions of dollars)ADAADBAD2023ABASSuppose the unemployment rate...
ECON 1150
In the year 2023, aggregate demand and aggregate supply in the fictional country of Gurder are represented by the curves AD2023AD2023 and AS on the following graph.Suppose the natural rate of output in this economy is $6 trillion.On the following graph, use the green line (triangle symbol) to plot the long-run aggregate-supply (LRAS) curve for this economy.LRASOutcome C0246810121416108107106105104103102101100PRICE LEVELOUTPUT (Trillions of dollars)ADAADBAD2023ABASEconomists have forecast that if the government does nothing and the economy continues to grow at the current rate, aggregate demand...
The short-run trade-off between the rate of inflation and the unemployment rate is best represented by:
The short-run trade-off between the rate of inflation and the unemployment rate is best represented by: A. the long-run aggregate supply curve. B. the aggregate demand curve. C. the short-run aggregate supply curve. D. the Phillips curve.
2. Phillips Curve. An economy has the following functions for its short run aggregate supply (SRAS),...
 2. Phillips Curve. An economy has the following functions for its short run aggregate supply (SRAS), Okun's Law (OL), and Phillips Curve (PC): SRAS: P = EP + (1/2)(y - 3) OL: (Y-Y) = -4(u-u") PC:T = ET - (1/5)( - 6) The economy begins at its natural rate of output with a stable price level equal to $5. a.) Output is at its natural level when the price level is equal to expectations. Calculate the natural rate of output...
ECON 1150
The following graph represents the money market in a hypothetical economy. This economy has a central bank, but unlike in Canada, the economy is closed (that is, the economy does not interact with other economies in the world). The money market is currently in equilibrium at an interest rate of 2.5% and a quantity of money equal to $0.4 trillion, as indicated by the grey star.New MS CurveNew Equilibrium00.10.20.30.40.50.60.70.84.54.03.53.02.52.01.51.00.5INTEREST RATE (Percent)MONEY (Trillions of dollars)Money SupplyMoney Demand Suppose the central bank announces...
Detailed explanations please! I am confused Other things the same, an increase in the expected price...
 Detailed explanations please! I am confused
Other things the same, an increase in the expected price level shifts a short-run aggregate supply right b. short-run aggregate supply left c. aggregate-demand right. d. aggregated-demand left Figure 35-1. The left-hand graph shows a short-run aggregate-supply (SRAS) curve and two aggregato-demand (AD) curves. On the right-hand diagram, U represents the unemployment rate Phallips Curve SRAS 30 \B 130 15 115 High AD :Low AD 0% 10% 2 Refer to Figure 35-1. The curve...
Detailed explanations please! I am confused
Other things the same, an increase in the expected price level shifts a short-run aggregate supply right b. short-run aggregate supply left c. aggregate-demand right. d. aggregated-demand left Figure 35-1. The left-hand graph shows a short-run aggregate-supply (SRAS) curve and two aggregato-demand (AD) curves. On the right-hand diagram, U represents the unemployment rate Phallips Curve SRAS 30 \B 130 15 115 High AD :Low AD 0% 10% 2 Refer to Figure 35-1. The curve...
Suppose that workers and firms perfectly forecast inflation, so that the real wage remains unchanged as...
 Suppose that workers and firms perfectly forecast inflation, so that the real wage remains unchanged as the price level rises over time. Prices and wages rise at the same rate, which implies that the real wage stays constant. The following graph shows the aggregate demand curve (AD) in an economy in long-run equilibrium. Assume the natural rate of unemployment is 6%, and potential output is $50 trillion. Use the orange points (square symbol) to draw the aggregate supply curve in...
Figure 17-7 Inflation rate (percent per year) Long-run Phillips curve 10% 5 Short-run Phillips curve 0...
 Figure 17-7 Inflation rate (percent per year) Long-run Phillips curve 10% 5 Short-run Phillips curve 0 5.5% 7.5 Unemployment rate (percent) Refer to Figure 17-7. Consider the Phillips curves depicted in the graph above. The Fed announces its intention to decrease inflation from 10 percent to 5 percent per year, and it succeeds. If expectations of inflation are reduced to 8 percent by the Fed's announcement, the rate of unemployment will be _in the short run. less than 5.5 percent...
ECON 1150
The following graph shows the money market in a hypothetical economy. Assume that the central bank fixes the quantity of money supplied.Suppose the price level decreases from 150 to 125.Shift the appropriate curve on the graph to show the impact of a decrease in the overall price level on the market for money.Money DemandMoney Supply0510152025301815129630INTEREST RATE (Percent)MONEY (Billions of dollars)Money Demand Money Supply After the decrease in the price level, the quantity of money demanded at the initial interest rate of 9%...
3. Aggregate Supply Shocks Suppose that a small economy that depends mostly on agriculture experiences a...
 3. Aggregate Supply Shocks Suppose that a small economy that depends mostly on agriculture experiences a year with exceptionally good conditions for growing crops. What would the good weather do to the Short-run Aaggregate Supply curve and the Short-run Phillips Curve? a. It would shift both the Short-run Aggregate Supply Curve and the Short-run Phillips Curve b. It would shift both the Short-run Aggregate Supply curve and the Short-run Phillips Curve c. It would shift the Short-run Aggregate Supply Curve...
 2. Phillips Curve. An economy has the following functions for its short run aggregate supply (SRAS), Okun's Law (OL), and Phillips Curve (PC): SRAS: P = EP + (1/2)(y - 3) OL: (Y-Y) = -4(u-u") PC:T = ET - (1/5)( - 6) The economy begins at its natural rate of output with a stable price level equal to $5. a.) Output is at its natural level when the price level is equal to expectations. Calculate the natural rate of output...
 Detailed explanations please! I am confused
Other things the same, an increase in the expected price level shifts a short-run aggregate supply right b. short-run aggregate supply left c. aggregate-demand right. d. aggregated-demand left Figure 35-1. The left-hand graph shows a short-run aggregate-supply (SRAS) curve and two aggregato-demand (AD) curves. On the right-hand diagram, U represents the unemployment rate Phallips Curve SRAS 30 \B 130 15 115 High AD :Low AD 0% 10% 2 Refer to Figure 35-1. The curve...
Detailed explanations please! I am confused
Other things the same, an increase in the expected price level shifts a short-run aggregate supply right b. short-run aggregate supply left c. aggregate-demand right. d. aggregated-demand left Figure 35-1. The left-hand graph shows a short-run aggregate-supply (SRAS) curve and two aggregato-demand (AD) curves. On the right-hand diagram, U represents the unemployment rate Phallips Curve SRAS 30 \B 130 15 115 High AD :Low AD 0% 10% 2 Refer to Figure 35-1. The curve...
 Suppose that workers and firms perfectly forecast inflation, so that the real wage remains unchanged as the price level rises over time. Prices and wages rise at the same rate, which implies that the real wage stays constant. The following graph shows the aggregate demand curve (AD) in an economy in long-run equilibrium. Assume the natural rate of unemployment is 6%, and potential output is $50 trillion. Use the orange points (square symbol) to draw the aggregate supply curve in...
 Figure 17-7 Inflation rate (percent per year) Long-run Phillips curve 10% 5 Short-run Phillips curve 0 5.5% 7.5 Unemployment rate (percent) Refer to Figure 17-7. Consider the Phillips curves depicted in the graph above. The Fed announces its intention to decrease inflation from 10 percent to 5 percent per year, and it succeeds. If expectations of inflation are reduced to 8 percent by the Fed's announcement, the rate of unemployment will be _in the short run. less than 5.5 percent...
 3. Aggregate Supply Shocks Suppose that a small economy that depends mostly on agriculture experiences a year with exceptionally good conditions for growing crops. What would the good weather do to the Short-run Aaggregate Supply curve and the Short-run Phillips Curve? a. It would shift both the Short-run Aggregate Supply Curve and the Short-run Phillips Curve b. It would shift both the Short-run Aggregate Supply curve and the Short-run Phillips Curve c. It would shift the Short-run Aggregate Supply Curve...
Most questions answered within 3 hours.
-
A manufacturing company preparing to build a new plant is
considering three potential locations for it....
asked 28 minutes ago -
A .15kg rubber ball is bounced off a wall. Before hitting the
wall, the ball moves...
asked 27 minutes ago -
B. If compound Y has approximately the same values of solubility
in toluene as compound X,...
asked 1 hour ago -
Oscar Inc. has inventory in Japan valued at 39,051,000 Yen one
year ago. One year ago...
asked 1 hour ago -
If Canada suffered from "fundamental disequilibrium," and its
government choose not to devalue its currency, a...
asked 1 hour ago -
4. How many input & output Key Value Pairs are passed into,
and emitted out of...
asked 1 hour ago -
Why would your heart not function well if constructed of
skeletal muscle? What is the particular...
asked 1 hour ago -
Please respond to this essay question in full essay form for
Chemistry 1102 Organic and Biochemistry:...
asked 1 hour ago -
Determine the head loss and velocity of flow in a water supply main
of 15.0 cm...
asked 1 hour ago -
A marketing executive who knowingly authorizes a shoddy
defective product to be brought to market is...
asked 1 hour ago -
Write a psudocode:
1. Define a function called authorize that takes in 2 strings,
uName, and...
asked 1 hour ago -
What Hall voltage (in mV) is produced by a 0.180 T field applied
across a 2.60...
asked 1 hour ago