
Homework Answers
Given
Consumer Surplus ( It is the area below the demand curve and above price line.) = $200
Producer Surplus ( It is the area below the price line and above supply curve.) = $600
In monopoly, Equilibrium price and quantity are found by the equilibrium condition. As per the diagram, P(M)= 60 and Q(M)= 20
In perfect competition, MC represents the supply curve and
Equilibrium is given by P(C)= 70 Q(C)= 30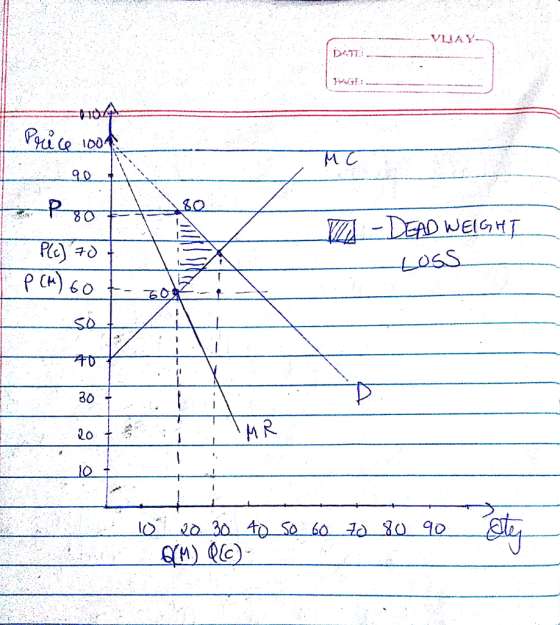
Deadweight loss is given by = 1/2*(Q(C)- Q (M)* (P- P(M)
=1/2*(30-20)*(80-60)
= 1/2*(10)*(20)
=$100 Ans
Add Answer to:
Concept: Consumer and Producer Surplus Suppose a local cable company provides cable service to a rural...
Question 12 (1 point) This graph shows the demand for cable TV services in a town...
 Question 12 (1 point) This graph shows the demand for cable TV services in a town of 50,000 households. The local government has given a monopoly franchise to a cable company. The graph also shows the marginal revenue (MR) curve, the marginal cost (MC) curve, and the average total cost (ATC) curve for cable TV services. Notice that the firm's monthly marginal cost is constant at $10 per household. Assume that in the long run, the cable company can avoid...
8. Natural monopoly analysis
8. Natural monopoly analysisThe following graph shows the demand (D) for cable services in the imaginary town of Utilityburg. The graph also shows the marginal revenue (MR) curve, the marginal cost (MC) curve, and the average total cost (ATC) curve for the local cable company, a natural monopolist.On the following graph, use the black point (plus symbol) to indicate the profit-maximizing price and quantity for this natural monopolist.Monopoly Outcome024681012141618201009080706050403020100PRICE (Dollars per subscription)QUANTITY (Number of subscriptions)DMRMCATCWhich of the following statements are...
Need help with this problem. Where do i plot the monopoly outcome on the graph and...
 Need help with this problem. Where do i plot the monopoly
outcome on the graph and also answering the following questions. I
will rate. thanks!
8. Natural monopoly analysis The following graph shows the demand (D) for cable services in the imaginary town of Utilityburg. The graph also shows the marginal revenue (MR) curve, the marginal cost (MC) curve, and the average total cost (ATC) curve for the local cable company, a natural monopolist. On the following graph, use the...
Need help with this problem. Where do i plot the monopoly
outcome on the graph and also answering the following questions. I
will rate. thanks!
8. Natural monopoly analysis The following graph shows the demand (D) for cable services in the imaginary town of Utilityburg. The graph also shows the marginal revenue (MR) curve, the marginal cost (MC) curve, and the average total cost (ATC) curve for the local cable company, a natural monopolist. On the following graph, use the...
Cost of Quality and Value-Added/Non -Value-Added Reports for a Service Company Three Rivers Inc. provides cable TV and Internet service to the local community. The activities and activity...
 Cost of Quality and Value-Added/Non -Value-Added Reports for a Service Company Three Rivers Inc. provides cable TV and Internet service to the local community. The activities and activity costs of Three Rivers are identified as follows: a. Identify the cost of quality classification for each activity and whether the activity is value-added or non-value-added. Value-Added / Activity Quality Cost Non-Value-Added Quality Control Activities Cost Classification Classification Billing error correction $24,500 Cable signal testing 91,800 Reinstalling service (installed incorrectly the first...
(67)Suppose that when the price of cherries is $10 per lb, the quantity supplied of cherries...
(67)Suppose that when the price of cherries is $10 per lb, the quantity supplied of cherries is 20 lbs. When price of cherries is $6 per lb, the quantity supplied of cherries is 12 lbs. The price elasticity of supply is: (a)1.7 (b)1.0 (c)2.5 (d)0.8 (68)If an excise tax is placed on the producer of a product that has a perfectly inelastic demand, given ceteris paribus then: (a)The entire tax will be paid by the producer (b)The consumer and producer...
13) The cost the Almy type of market 7) The market is an example of A)...
 13) The cost the Almy type of market 7) The market is an example of A) mattress: a monopoly B) com a perfectly competitive C) car insurance an oligopoly D) cell phone; a perfectly competitive 5) airplane manufacturing a monopolistically competitive 8) What is the difference between perfect competition and monopolistic competition? A) Perfect competition has a large number of small firms while monopolistic competition does not in monopolistic competition, firms produce identical goods, while in perfect competition, firms produce...
 Question 12 (1 point) This graph shows the demand for cable TV services in a town of 50,000 households. The local government has given a monopoly franchise to a cable company. The graph also shows the marginal revenue (MR) curve, the marginal cost (MC) curve, and the average total cost (ATC) curve for cable TV services. Notice that the firm's monthly marginal cost is constant at $10 per household. Assume that in the long run, the cable company can avoid...
 Need help with this problem. Where do i plot the monopoly
outcome on the graph and also answering the following questions. I
will rate. thanks!
8. Natural monopoly analysis The following graph shows the demand (D) for cable services in the imaginary town of Utilityburg. The graph also shows the marginal revenue (MR) curve, the marginal cost (MC) curve, and the average total cost (ATC) curve for the local cable company, a natural monopolist. On the following graph, use the...
Need help with this problem. Where do i plot the monopoly
outcome on the graph and also answering the following questions. I
will rate. thanks!
8. Natural monopoly analysis The following graph shows the demand (D) for cable services in the imaginary town of Utilityburg. The graph also shows the marginal revenue (MR) curve, the marginal cost (MC) curve, and the average total cost (ATC) curve for the local cable company, a natural monopolist. On the following graph, use the...
 Cost of Quality and Value-Added/Non -Value-Added Reports for a Service Company Three Rivers Inc. provides cable TV and Internet service to the local community. The activities and activity costs of Three Rivers are identified as follows: a. Identify the cost of quality classification for each activity and whether the activity is value-added or non-value-added. Value-Added / Activity Quality Cost Non-Value-Added Quality Control Activities Cost Classification Classification Billing error correction $24,500 Cable signal testing 91,800 Reinstalling service (installed incorrectly the first...
 13) The cost the Almy type of market 7) The market is an example of A) mattress: a monopoly B) com a perfectly competitive C) car insurance an oligopoly D) cell phone; a perfectly competitive 5) airplane manufacturing a monopolistically competitive 8) What is the difference between perfect competition and monopolistic competition? A) Perfect competition has a large number of small firms while monopolistic competition does not in monopolistic competition, firms produce identical goods, while in perfect competition, firms produce...
Most questions answered within 3 hours.
-
A 0.48-kg metal sphere oscillates at the end of a vertical
spring. As the spring stretches...
asked 2 minutes ago -
If a block of Si is doped with 10^17 Boron atom/cm^3 and 5X10^16
Arsenic atoms/cm^3,
(a)...
asked 29 minutes ago -
Why would natural selection not minimize costs (in the form of
symptoms) of evolved defenses? (choose...
asked 47 minutes ago -
What is true about a critical task?
Latest finish time - latest start time = 0...
asked 49 minutes ago -
A company uses a
process costing system. Its Assembly Department's beginning
inventory consisted of 56,800 units,...
asked 49 minutes ago -
a
sealed glass cylinder contains 325 g of N2 gas at 1.02 atm at 20 c....
asked 53 minutes ago -
The main difference between an equity and a nonequity alliance
is that
A
equity alliances are...
asked 52 minutes ago -
Need help with this, in JAVA, using netbeans. A
complete response will receive a positive comment...
asked 1 hour ago -
An imprest petty cash fund of $600 was established for minor
disbursements. At the end of...
asked 1 hour ago -
Sharpe Cutter is a small company that produces specialty knives
for paper cutting machinery. The annual...
asked 1 hour ago -
Calculating the Ka of a weak acid from
pH:
The pH of a 0.68M solution of...
asked 1 hour ago -
1.What process is pushing back against gravity in the very
center (the core) of sun-like stars?...
asked 1 hour ago