Describe the shape of AFC(average fixed cost), AVC(Average Variable cost), ATC(Average total cost) and MC(Marginal cost)...
Describe the shape of AFC(average fixed cost), AVC(Average Variable cost), ATC(Average total cost) and MC(Marginal cost) Explain graphic relationship among ATC, AVC and MC.
I would be appreciated if the answered in 5senteces,
Homework Answers
Since TC=TFC+TVC
ATC=AFC+AVC
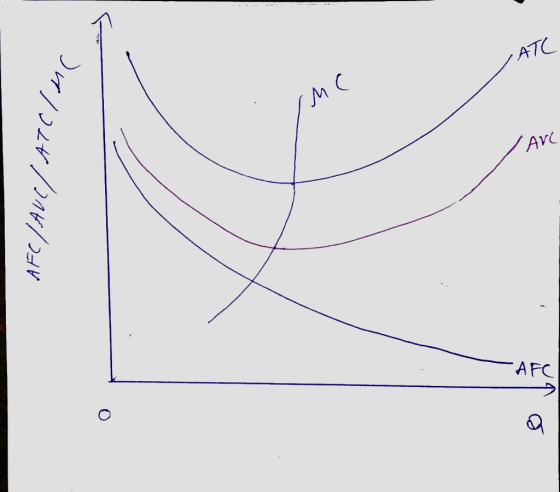
Since the TFC is fixed, do the shape of AFC is downward sloping from left to right.
Average variable cost curve is U shaped curve.
The ATC and AVC is U shape curve but there is gap between ATC and AVC due to AFC.
MC cuts AVC and ATC at its minimum point.
All this have been shown in the below diagram.
Add Answer to:
Describe the shape of AFC(average fixed cost), AVC(Average
Variable cost), ATC(Average total cost) and MC(Marginal cost)...
pogu u (a) Calculate the fixed cost (FC), average fixed cost (AFC), average variable cost (AVC),...
 pogu u (a) Calculate the fixed cost (FC), average fixed cost (AFC), average variable cost (AVC), average total cost (ATC) and marginal cost (MC) from the table below. Units of output Total cost AFC ATC FC 50 AVC 0 0 MC 0 0 80 128 180 280 405 (b) Draw graphs to plot these cost curves against output. (c) Explain what these shapes tell us about returns and efficiency.
Calculate A) Total Fixed Cost (TFC), Total Variable Cost (TVC), Average Fixed Cost (AFC), Average Variable...
Calculate A) Total Fixed Cost (TFC), Total Variable Cost (TVC), Average Fixed Cost (AFC), Average Variable Cost (AVC), Average Total Cost (ATC), and Marginal Cost (MC). B) Graph the average fixed cost (AFC), average variable cost (AVC), average total cost (ATC), and the marginal cost (MC) curves on one graph and TFC curve, TVC cost curve, and TC curve on another graph. Quantity Produced Total Cost 0 $ 120 1 135 2 148 3 159 ...
Finish the table. MPL: Marginal production of labor TC: Total cost MC: Marginal Cost AFC: Average...
 Finish the table.
MPL: Marginal production of labor
TC: Total cost
MC: Marginal Cost
AFC: Average fixed cost
AVC: Average variable cost
ATC: Average total cost
lormal text - Times New... - 12 B I VA G E A E 1 E- Labor Week 6 Assignment: Production Costs 20 Points) Output MPL FC VC TC MC AFC AVC ATC (Q) 0 25 WN 25 50 75 100 13 25 15 F 16 25 125 1. Complete the table above. (4...
Finish the table.
MPL: Marginal production of labor
TC: Total cost
MC: Marginal Cost
AFC: Average fixed cost
AVC: Average variable cost
ATC: Average total cost
lormal text - Times New... - 12 B I VA G E A E 1 E- Labor Week 6 Assignment: Production Costs 20 Points) Output MPL FC VC TC MC AFC AVC ATC (Q) 0 25 WN 25 50 75 100 13 25 15 F 16 25 125 1. Complete the table above. (4...
How to calculate the Total Cost (TC), Average Fixed Cost (AFC), Average Total Cost (ATC), and...
 How to calculate the Total Cost (TC), Average Fixed Cost
(AFC), Average Total Cost (ATC), and Marginal Cost (MC)?
1. The schedule below gives the Total Variable Cost (TVC) for producing various quantities of smurfs (smurfs are an input into cat food production). The Total Fixed Costs (TFC) is $100. Calculate the following and fill in the blanks: Total Cost (TC), Average Fixed Cost (AFC), Average Variable Cost (AVC), Average Total Cost (ATC), and Marginal Cost (MC). Cost Schedule for...
How to calculate the Total Cost (TC), Average Fixed Cost
(AFC), Average Total Cost (ATC), and Marginal Cost (MC)?
1. The schedule below gives the Total Variable Cost (TVC) for producing various quantities of smurfs (smurfs are an input into cat food production). The Total Fixed Costs (TFC) is $100. Calculate the following and fill in the blanks: Total Cost (TC), Average Fixed Cost (AFC), Average Variable Cost (AVC), Average Total Cost (ATC), and Marginal Cost (MC). Cost Schedule for...
Output Total Cost Fixed Cost Variable Cost AFC AVC ATC MC 0 50 1 130 2...
Output Total Cost Fixed Cost Variable Cost AFC AVC ATC MC 0 50 1 130 2 190 3 230 4 250 5 310 6 400 7 540 8 800 9 1200 The market supply curve is the sum of the marginal cost curves of all the firms in the market. The market supply of a competitive industry is determined by:
The curves show the marginal cost (MC), average variable cost (AVC), and average total cost (ATC)...
 The curves show the marginal cost (MC), average variable cost (AVC), and average total cost (ATC) functions for a firm in a competitive market. Using the straight-line tool, draw a straight line, all the way from the left edge of the graph to the right edge, to represent the minimum price at which the firm should continue operating.
Labor TVC TC MC AFC AVC ATC 25 50 75 100 25 125 (a) Complete...
 Labor TVC TC MC AFC AVC ATC 25 50 75 100 25 125 (a) Complete the blank columns (5 points). Please create a table like mine and fill it. (b) Assume the price of this product equals $10. What's the profit-maximizing output (q)? (3 points). Note: managers maximize profits by setting MR=MC and under perfectly competitive markets, MR=Price. Thus, maximize profit by producing a where P=MC.(2 points) (c) What is the profit? (3 points) TOTAL COST (TC) - the...
The marginal costs (MC), average variable costs (AVC), and average total costs (ATC) for a monopoly...
 The marginal costs (MC), average variable costs (AVC), and average total costs (ATC) for a monopoly are shown in the figure below. The figure also shows the demand curve (D) and the marginal revenue curve (MR) for this market. Instructions: Use the tools provided to plot the profit-maximizing quantity (Q), the profit-maximizing price (P), the profit (Profit), and the deadweight loss (DWL). Note that the deadweight loss will be only approximate due to the curvature of the marginal cost curve....
Output Total Costs Fixed Costs Variable Costs AFC AVC ATC MC 0 100 100 0 1...
Output Total Costs Fixed Costs Variable Costs AFC AVC ATC MC 0 100 100 0 1 150 100 50 100 50 150 50 2 225 100 125 50 62.5 112.5 75 3 230 100 130 33.33 43.33 76.67 5 4 300 100 200 25 50 75 70 5 400 100 300 20 60 80 100 Graph the average and marginal cost curves from the previous question. What would be the optimal output, assuming you want to minimize diminishing returns?
The curves show the marginal cost (MC), average variable cost (AVC) and average total cost (ATC)...
 The curves show the marginal cost (MC), average variable cost (AVC) and average total cost (ATC) curves for a firm that sell mid-range cars in a competitive market. Use the area tool to draw the area representing the firms profit or loss, if the firm produce 6000 cars. Your answer should be a rectangle drawn with four corners
When the firm produce 6000 cars it earn a profit or suffer a loss of ----- million
The curves show the marginal cost (MC), average variable cost (AVC) and average total cost (ATC) curves for a firm that sell mid-range cars in a competitive market. Use the area tool to draw the area representing the firms profit or loss, if the firm produce 6000 cars. Your answer should be a rectangle drawn with four corners
When the firm produce 6000 cars it earn a profit or suffer a loss of ----- million
 pogu u (a) Calculate the fixed cost (FC), average fixed cost (AFC), average variable cost (AVC), average total cost (ATC) and marginal cost (MC) from the table below. Units of output Total cost AFC ATC FC 50 AVC 0 0 MC 0 0 80 128 180 280 405 (b) Draw graphs to plot these cost curves against output. (c) Explain what these shapes tell us about returns and efficiency.
 Finish the table.
MPL: Marginal production of labor
TC: Total cost
MC: Marginal Cost
AFC: Average fixed cost
AVC: Average variable cost
ATC: Average total cost
lormal text - Times New... - 12 B I VA G E A E 1 E- Labor Week 6 Assignment: Production Costs 20 Points) Output MPL FC VC TC MC AFC AVC ATC (Q) 0 25 WN 25 50 75 100 13 25 15 F 16 25 125 1. Complete the table above. (4...
Finish the table.
MPL: Marginal production of labor
TC: Total cost
MC: Marginal Cost
AFC: Average fixed cost
AVC: Average variable cost
ATC: Average total cost
lormal text - Times New... - 12 B I VA G E A E 1 E- Labor Week 6 Assignment: Production Costs 20 Points) Output MPL FC VC TC MC AFC AVC ATC (Q) 0 25 WN 25 50 75 100 13 25 15 F 16 25 125 1. Complete the table above. (4...
 How to calculate the Total Cost (TC), Average Fixed Cost
(AFC), Average Total Cost (ATC), and Marginal Cost (MC)?
1. The schedule below gives the Total Variable Cost (TVC) for producing various quantities of smurfs (smurfs are an input into cat food production). The Total Fixed Costs (TFC) is $100. Calculate the following and fill in the blanks: Total Cost (TC), Average Fixed Cost (AFC), Average Variable Cost (AVC), Average Total Cost (ATC), and Marginal Cost (MC). Cost Schedule for...
How to calculate the Total Cost (TC), Average Fixed Cost
(AFC), Average Total Cost (ATC), and Marginal Cost (MC)?
1. The schedule below gives the Total Variable Cost (TVC) for producing various quantities of smurfs (smurfs are an input into cat food production). The Total Fixed Costs (TFC) is $100. Calculate the following and fill in the blanks: Total Cost (TC), Average Fixed Cost (AFC), Average Variable Cost (AVC), Average Total Cost (ATC), and Marginal Cost (MC). Cost Schedule for...
 The curves show the marginal cost (MC), average variable cost (AVC), and average total cost (ATC) functions for a firm in a competitive market. Using the straight-line tool, draw a straight line, all the way from the left edge of the graph to the right edge, to represent the minimum price at which the firm should continue operating.
 Labor TVC TC MC AFC AVC ATC 25 50 75 100 25 125 (a) Complete the blank columns (5 points). Please create a table like mine and fill it. (b) Assume the price of this product equals $10. What's the profit-maximizing output (q)? (3 points). Note: managers maximize profits by setting MR=MC and under perfectly competitive markets, MR=Price. Thus, maximize profit by producing a where P=MC.(2 points) (c) What is the profit? (3 points) TOTAL COST (TC) - the...
 The marginal costs (MC), average variable costs (AVC), and average total costs (ATC) for a monopoly are shown in the figure below. The figure also shows the demand curve (D) and the marginal revenue curve (MR) for this market. Instructions: Use the tools provided to plot the profit-maximizing quantity (Q), the profit-maximizing price (P), the profit (Profit), and the deadweight loss (DWL). Note that the deadweight loss will be only approximate due to the curvature of the marginal cost curve....
 The curves show the marginal cost (MC), average variable cost (AVC) and average total cost (ATC) curves for a firm that sell mid-range cars in a competitive market. Use the area tool to draw the area representing the firms profit or loss, if the firm produce 6000 cars. Your answer should be a rectangle drawn with four corners
When the firm produce 6000 cars it earn a profit or suffer a loss of ----- million
The curves show the marginal cost (MC), average variable cost (AVC) and average total cost (ATC) curves for a firm that sell mid-range cars in a competitive market. Use the area tool to draw the area representing the firms profit or loss, if the firm produce 6000 cars. Your answer should be a rectangle drawn with four corners
When the firm produce 6000 cars it earn a profit or suffer a loss of ----- million
Most questions answered within 3 hours.
-
5. Suppose you obtained 0.55 g of crude clove oil from 7.0 g of
fresh cloves....
asked 4 minutes ago -
Provide a paragraph of introduction that generally describes
cognitive development over the lifespan.
asked 9 minutes ago -
In a market, when the price increased the total expenditure on
the good also increased. Is...
asked 9 minutes ago -
If 5.70 g of potassium react with water, how many grams of
hydrogen gas, H2, are...
asked 23 minutes ago -
How many moles of CO2 and H2O will be
produced by combustion analysis of 0.010 mol...
asked 21 minutes ago -
Tennis champion Maria Sharapova is capable of serving a tennis
ball at 126 mph.
b) What...
asked 29 minutes ago -
The electric potential V in the space between the plates of a
given vacuum tube is...
asked 38 minutes ago -
The Hydroboration-Oxidation of an Alkene to Yield 1-Octanol.
1-octene to 1-octanol using BH3-THF
What might be...
asked 44 minutes ago -
You draw and keep a single bill from a hat that contains a
$11, $55, $20...
asked 1 hour ago -
Write a Java program that has the following methods:
findSum - a method that takes in...
asked 1 hour ago -
A coffee cup calorimeter initially contains 135g of water at
22.0oC. Calcium chloride (21.0g) at the...
asked 1 hour ago -
A patient is having a magnetic resonance imaging scan (an MRI)
and has neglected to remove...
asked 1 hour ago