You are an investor with an investment horizon of one year and a certain degree of...
You are an investor with an investment horizon of one year and a certain degree of risk aversion. Your task is to determine the efficient frontier in the case of two risky securities and one risk-free (T-bill) security and select the optimal portfolio depending on your risk-aversion parameter. You need to do your work on a spreadsheet (use one that you are comfortable with).
The following steps will help you accomplish this task:
1- Choose
- A well-diversified risky bond B represented by its E(RB) and SD(B).
- A well-diversified stock fund S represented by its E(RS) and SD(S).
- A T-bill with one-year maturity represented by RF.
Choose the one-year risk-free rate to be 5%. (a) E(RB) = 9%, SD(B) = 14%, E(RS) = 14%, SD(S) = 20%
2- Choose a correlation coefficient between B and S.
Choose one of the following: (b) Corr(B,S) = 0.30
3- Make simulations on standard deviation SD(P) and expected rate of return E(RP) of a "complete" portfolio (formed with B and S) by varying the weights allocated on B and S.
4- Construct and graph the opportunity set (feasible set) for B and S from your simulations.
5- Compute the weights of the tangent portfolio (T).
6- Compute the SD(T) and E(RT) of the tangent portfolio (T).
7- Add the T-bill to your portfolio and redo step 3.
8- Repeat step 4 with the T-bill rate.
Homework Answers
(A) Simulation of the portfolio with diff weights assign to the bond and stock with excel workbook
SD of Portfolio= W12 12+W2222+2*W1*W2*
 121*2
121*2
Where 1 and 2 is stock and bond and
is Std. Deviation and
is coefficient of correlation and W is Weight
Now for the Portfolio Return = W1*R1+W2*R2
Now here i snip the clip of excel work book which show you the simulation with different weights of portfolio return and portfolio Std. Deviation.

(B) Construction of graph the opportunity set for B and S from Simulation.
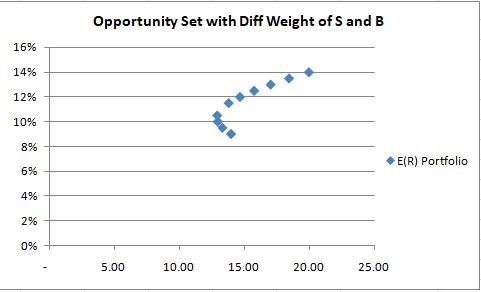
(C) In opinion Portfolio weight of 0.7 of B and 0.3 of S is best opportunity set because it has least Risk(SD) and Better Return so, this called as Tangent and SD of Tangent Portfolio is 12.94 and ER of same is 10.5%.
(D) To compute the Portfolio Return and SD with combing T-Bill with 5% rate in this case you return will increase with diff sets of weight combination and important point is that no risk (SD) will further rise because T-Bill is risk free instrument so, we construct the graph and the chart also.
Add Answer to:
You are an investor with an investment horizon of one year and a
certain degree of...
Tom has $10,000. He can invest the money in (1) a corporate bond, (2) a stock,...
Tom has $10,000. He can invest the money in (1) a corporate bond, (2) a stock, and (3) the risk-free T-bill. The table below provides these assets’ expected returns and standard deviations: Bond (D) Stock (E) T-Bill (F) Expected Return 5% 10% 2% Standard Deviation 10% 20% 0 The coefficient of correlation between the corporate bond and the stock (ρDE) is 30%. Tom has a risk aversion coefficient of A=5. To construct the optimal portfolio with two risky assets and...
3. You have a risky portfolio that yields an expected rate of return of 15% with...
3. You have a risky portfolio that yields an expected rate of return of 15% with a standard deviation of 25%. Draw the CAL for an expected return/standard deviation diagram if the risk free rate is 5%. a. What is the slope of the CAL? b. If your coefficient of risk aversion is 5, how much should you invest in the risky portfolio? 4. A pension fund manager is considering three mutual funds. The first is a stock fund, the...
Greta, an elderly investor, has a degree of risk aversion of A = 5 when applied...
 Greta, an elderly investor, has a degree of risk
aversion of A = 5 when applied to return on wealth over a one-year
horizon. She is pondering two portfolios, the S&P 500 and a
hedge fund, as well as a number of one-year strategies. (All rates
are annual and continuously compounded.) The S&P 500 risk
premium is estimated at 5% per year, with a SD of 20%. The hedge
fund risk premium is estimated at 12% with a SD of...
Greta, an elderly investor, has a degree of risk
aversion of A = 5 when applied to return on wealth over a one-year
horizon. She is pondering two portfolios, the S&P 500 and a
hedge fund, as well as a number of one-year strategies. (All rates
are annual and continuously compounded.) The S&P 500 risk
premium is estimated at 5% per year, with a SD of 20%. The hedge
fund risk premium is estimated at 12% with a SD of...
Greta, an elderly investor, has a degree of risk aversion of A = 3 when applied...
 Greta, an elderly investor, has a degree of risk
aversion of A = 3 when applied to return on wealth over a one-year
horizon. She is pondering two portfolios, the S&P 500 and a
hedge fund, as well as a number of one-year strategies. (All rates
are annual and continuously compounded.) The S&P 500 risk
premium is estimated at 8.4% per year, with a SD of 23.4%. The
hedge fund risk premium is estimated at 13.4% with a SD of...
Greta, an elderly investor, has a degree of risk
aversion of A = 3 when applied to return on wealth over a one-year
horizon. She is pondering two portfolios, the S&P 500 and a
hedge fund, as well as a number of one-year strategies. (All rates
are annual and continuously compounded.) The S&P 500 risk
premium is estimated at 8.4% per year, with a SD of 23.4%. The
hedge fund risk premium is estimated at 13.4% with a SD of...
Greta, an elderly investor, has a degree of risk aversion of A = 3 when applied...
 Greta, an elderly investor, has a degree of risk aversion of A =
3 when applied to return on wealth over a one-year horizon. She is
pondering two portfolios, the S&P 500 and a hedge fund, as well
as a number of one-year strategies. (All rates are annual and
continuously compounded.) The S&P 500 risk premium is estimated
at 7.2% per year, with a SD of 22.2%. The hedge fund risk premium
is estimated at 12.2% with a SD of...
Greta, an elderly investor, has a degree of risk aversion of A =
3 when applied to return on wealth over a one-year horizon. She is
pondering two portfolios, the S&P 500 and a hedge fund, as well
as a number of one-year strategies. (All rates are annual and
continuously compounded.) The S&P 500 risk premium is estimated
at 7.2% per year, with a SD of 22.2%. The hedge fund risk premium
is estimated at 12.2% with a SD of...
Greta, an elderly investor, has a degree of risk aversion of A = 3 when applied...
Greta, an elderly investor, has a degree of risk aversion of A = 3 when applied to return on wealth over a one-year horizon. She is pondering two portfolios, the S&P 500 and a hedge fund, as well as a number of one-year strategies. (All rates are annual and continuously compounded.) The S&P 500 risk premium is estimated at 9% per year, with a SD of 23%. The hedge fund risk premium is estimated at 7% with a SD of...
For the following questions, assume that you manage a risky portfolio with an expected rate of...
 For the following questions, assume that you manage a risky portfolio with an expected rate of return of 18% and a standard deviation of 26%. The T-bill rate is 7%. 3. You have a risky portfolio that yields an expected rate of return of 15% with a standard deviation of 25%. Draw the CAL for an expected return/standard deviation diagram if the risk free rate is 5%. a. What is the slope of the CAL? b. If your coefficient of...
Greta, an elderly investor, has a degree of risk aversion of A = 4 when applied...
 Greta, an elderly investor, has a degree of risk aversion of A = 4 when applied to return on wealth over a one-year horizon. She is pondering two portfolios, the S&P 500 and a hedge fund, as well as a number of 4-year strategies. (All rates are annual, continuously compounded.) The S&P 500 risk premium is estimated at 7% per year, with a SD of 18%. The hedge fund risk premium is estimated at 5% with a SD of 25%....
Greta, an elderly investor, has a degree of risk aversion of A = 3 when applied...
 Greta, an elderly investor, has a degree of risk aversion of A = 3 when applied to return on wealth over a one-year horizon. She is pondering two portfolios, the S&P 500 and a hedge fund, as well as a number of 3-year strategies. (All rates are annual, continuously compounded.) The S&P 500 risk premium is estimated at 7% per year, with a SD of 20%. The hedge fund risk premium is estimated at 5% with a SD of 26%....
Greta, an elderly investor, has a degree of risk aversion of A= 3 when applied to...
 Greta, an elderly investor, has a degree of risk aversion of A= 3 when applied to return on wealth over a one-year horizon. She is pondering two portfolios, the S&P 500 and a hedge fund, as well as a number of 3-year strategies. (All rates are annual, continuously compounded.) The S&P 500 risk premium is estimated at 6% per year, with a SD of 21%. The hedge fund risk premium is estimated at 9% with a SD of 38%. The...
 Greta, an elderly investor, has a degree of risk
aversion of A = 5 when applied to return on wealth over a one-year
horizon. She is pondering two portfolios, the S&P 500 and a
hedge fund, as well as a number of one-year strategies. (All rates
are annual and continuously compounded.) The S&P 500 risk
premium is estimated at 5% per year, with a SD of 20%. The hedge
fund risk premium is estimated at 12% with a SD of...
Greta, an elderly investor, has a degree of risk
aversion of A = 5 when applied to return on wealth over a one-year
horizon. She is pondering two portfolios, the S&P 500 and a
hedge fund, as well as a number of one-year strategies. (All rates
are annual and continuously compounded.) The S&P 500 risk
premium is estimated at 5% per year, with a SD of 20%. The hedge
fund risk premium is estimated at 12% with a SD of...
 Greta, an elderly investor, has a degree of risk
aversion of A = 3 when applied to return on wealth over a one-year
horizon. She is pondering two portfolios, the S&P 500 and a
hedge fund, as well as a number of one-year strategies. (All rates
are annual and continuously compounded.) The S&P 500 risk
premium is estimated at 8.4% per year, with a SD of 23.4%. The
hedge fund risk premium is estimated at 13.4% with a SD of...
Greta, an elderly investor, has a degree of risk
aversion of A = 3 when applied to return on wealth over a one-year
horizon. She is pondering two portfolios, the S&P 500 and a
hedge fund, as well as a number of one-year strategies. (All rates
are annual and continuously compounded.) The S&P 500 risk
premium is estimated at 8.4% per year, with a SD of 23.4%. The
hedge fund risk premium is estimated at 13.4% with a SD of...
 Greta, an elderly investor, has a degree of risk aversion of A =
3 when applied to return on wealth over a one-year horizon. She is
pondering two portfolios, the S&P 500 and a hedge fund, as well
as a number of one-year strategies. (All rates are annual and
continuously compounded.) The S&P 500 risk premium is estimated
at 7.2% per year, with a SD of 22.2%. The hedge fund risk premium
is estimated at 12.2% with a SD of...
Greta, an elderly investor, has a degree of risk aversion of A =
3 when applied to return on wealth over a one-year horizon. She is
pondering two portfolios, the S&P 500 and a hedge fund, as well
as a number of one-year strategies. (All rates are annual and
continuously compounded.) The S&P 500 risk premium is estimated
at 7.2% per year, with a SD of 22.2%. The hedge fund risk premium
is estimated at 12.2% with a SD of...
 For the following questions, assume that you manage a risky portfolio with an expected rate of return of 18% and a standard deviation of 26%. The T-bill rate is 7%. 3. You have a risky portfolio that yields an expected rate of return of 15% with a standard deviation of 25%. Draw the CAL for an expected return/standard deviation diagram if the risk free rate is 5%. a. What is the slope of the CAL? b. If your coefficient of...
 Greta, an elderly investor, has a degree of risk aversion of A = 4 when applied to return on wealth over a one-year horizon. She is pondering two portfolios, the S&P 500 and a hedge fund, as well as a number of 4-year strategies. (All rates are annual, continuously compounded.) The S&P 500 risk premium is estimated at 7% per year, with a SD of 18%. The hedge fund risk premium is estimated at 5% with a SD of 25%....
 Greta, an elderly investor, has a degree of risk aversion of A = 3 when applied to return on wealth over a one-year horizon. She is pondering two portfolios, the S&P 500 and a hedge fund, as well as a number of 3-year strategies. (All rates are annual, continuously compounded.) The S&P 500 risk premium is estimated at 7% per year, with a SD of 20%. The hedge fund risk premium is estimated at 5% with a SD of 26%....
 Greta, an elderly investor, has a degree of risk aversion of A= 3 when applied to return on wealth over a one-year horizon. She is pondering two portfolios, the S&P 500 and a hedge fund, as well as a number of 3-year strategies. (All rates are annual, continuously compounded.) The S&P 500 risk premium is estimated at 6% per year, with a SD of 21%. The hedge fund risk premium is estimated at 9% with a SD of 38%. The...
Most questions answered within 3 hours.
-
Starting with benzene, synthesize 1-phenyl-1-butyne.
Show intermediates and reagents.
asked 9 minutes ago -
Create a 32-run crossed array design with six control factors
and two noise factors such that...
asked 1 hour ago -
A 500g sample of sand from source A has the following amounts
retained on each sieve....
asked 1 hour ago -
In
your own words, please explain the essay by John Keynes wrote "The
End of Laissez...
asked 1 hour ago -
How are the matrix and pixels related? Why are smaller
pixels better for diagnostic quality?
asked 1 hour ago -
2. An AC generator has 80 rectangular loops on
its armature. Each loop is 11 cm...
asked 1 hour ago -
Please help me with this question. Consider Aldi’s current and
potential geographic markets (see Exhibit 4...
asked 1 hour ago -
What are the main components of the fermentation process and
give an explanation of each? Include...
asked 1 hour ago -
Explain which types of cells in the body (belonging to which
organs, etc.) are sensitive to...
asked 1 hour ago -
A single cable supports an 703-kg elevator car. What is the
tension in the cable when...
asked 1 hour ago -
among the three different ways to link CSS specifications to an
HTML document (inline CSS, document...
asked 1 hour ago -
(1) Write the net ionic equation for the reaction that occurs
when equal volumes of 0.191...
asked 2 hours ago