

Homework Answers

Add Answer to:
Keith holds a portfolio that is invested equally in three stocks (Wp = WA = Wi-1/3)....
Keith holds a portfolio that is invested equally in three stocks (WD following table: WA w...
 Keith holds a portfolio that is invested equally in three stocks (WD following table: WA w 1/3). Each stock is described in the Stock Beta Standard Deviation Expected Return DET 0.7 AIL 1.0 INO 1.6 25% 38% 34% 8.0% 10.0% 13.5% An analyst has used market- and firm-specific information to make expected return estimates for each stock. The analyst's expected return estimates may or may not equal the stocks' required returns. The risk-free rate [Rr] is 6%, and the market...
Keith holds a portfolio that is invested equally in three stocks (wp = WA = WI...
 Keith holds a portfolio that is invested equally in three stocks (wp = WA = WI = 1/3). Each stock is described in the following table: Expected Return Standard Deviation 25% 8.0% Stock DET AIL INO Beta 0.7 1.0 1.6 38% 10.0% 34% 13.5% An analyst has used market and firm-specific information to make expected return estimates for each stock. The analyst's expected return estimates may or may not equal the stocks' required returns. The risk-free rate (TRF) is 6%,...
Keith holds a portfolio that is invested equally in three stocks (wd = wa = W1...
 Keith holds a portfolio that is invested equally in three stocks (wd = wa = W1 = 1/3). Each stock is described in the following table: Stock Beta Expected Return Standard Deviation 25% DET 0.7 8.0% AIL 1.0 38% 10.0% INO 1.6 34% 13.5% An analyst has used market- and firm-specific information to make expected return estimates for each stock. The analyst's expected return estimates may or may not equal the stocks' required returns. The risk-free rate [TRF) is 6%,...
Keith holds a portfolio that is invested equally in three stocks (wp = WA - wy...
 Keith holds a portfolio that is invested equally in three stocks (wp = WA - wy - 1/3). Each stock is described in the following table: Standard Deviation Expected Return Beta 0.7 1.0 25% Stock DET AIL INO 8.09 38% 10.0% 1.6 34% 13.54 An analyst has used market and firm specific information to make expected return estimates for each stock. The analyst's expected return estimates may or may not equal the stocks' required returns. The risk-free rate [ ]...
9. The Capital Asset Pricing Model and the security market line Keith holds a portfolio that...
 9. The Capital Asset Pricing Model and the security market line Keith holds a portfolio that is invested equally in three stocks (WD = WA = WI = 1/3). Each stock is described in the following table: Stock Beta Standard Deviation Expected Return DET 0.7 25% 8.0% AIL 1.0 38% 10.0% INO 1.6 13.5% 34% An analyst has used market- and firm-specific information to make expected return estimates for each stock. The analyst's expected return estimates may or may not...
Wilson holds a portfolio that invests equally in three stocks (WAWBWc following table: 1/3). Each...
 Wilson holds a portfolio that invests equally in three stocks (WAWBWc following table: 1/3). Each stock is described in the Stock Beta Standard Deviation Expected Return A 0.5 23% 38% 45% 7.5% 12.0% 14.0% C 2.0 An analyst has used market- and firm-specific information to generate expected return estimates for each stock. The analyst's expected return estimates may or may not equal the stocks' required returns. You've also determined that the risk-free rate [Rr] is 4%, and the market risk...
1/3). Each stock is described in the Wilson holds a portfolio that invests equally in three...
 1/3). Each stock is described in the Wilson holds a portfolio that invests equally in three stocks (WA = WB Wc following table: Stock Beta Standard Deviation Expected Return A 0.5 23% 7.5% B 1.0 38% 12.0% C 2.0 45% 14.0% An analyst has used market and firm-specific information to generate expected return estimates for each stock. The analyst's expected return estimates may or may not equal the stocks' required returns. You've also determined that the risk-free rate (TRF) is...
Wilson holds a portfolio that invests equally in three stocks (WA = WB = wc =...
 Wilson holds a portfolio that invests equally in three stocks (WA = WB = wc = 1/3). Each stock is described in the following table: Stock Beta Expected Return 0.5 Standard Deviation 23% 38% 7.5% 12.0% B C 1.0 2.0 45% 14.0% An analyst has used market and firm-specific information to generate expected return estimates for each stock. The analyst's expected return estimates may or may not equal the stocks' required returns. You've also determined that the risk-free rate (TRF)...
Please help with the graph. Where do I plot? For the bottom question, the options are...
 Please help with the graph. Where do I plot?
For the bottom question, the options are as follows.
1. equals, is more than, is less than.
2. in equilibrium, undervalued, overvalued.
3. in equilibrium, undervalued, overvalued.
Keith holds a portfolio that is invested equally in three stocks (wD = wA = w-1/3). Each stock is described in the following table Stock Beta Standard Deviation Expected Return DET 0.7 AIL 1.0 INO 1.6 25% 38% 34% 8.0% 10.0% 13.5% An analyst...
Please help with the graph. Where do I plot?
For the bottom question, the options are as follows.
1. equals, is more than, is less than.
2. in equilibrium, undervalued, overvalued.
3. in equilibrium, undervalued, overvalued.
Keith holds a portfolio that is invested equally in three stocks (wD = wA = w-1/3). Each stock is described in the following table Stock Beta Standard Deviation Expected Return DET 0.7 AIL 1.0 INO 1.6 25% 38% 34% 8.0% 10.0% 13.5% An analyst...
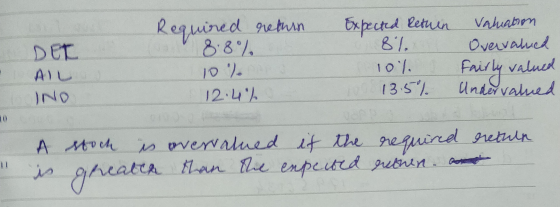
Options 1) is more than; equals; is less than 2 and 3) Overvalued; in equilibrium; undervalued...
 Options
1) is more than; equals; is less than
2 and 3) Overvalued; in equilibrium; undervalued
6. The Capital Asset Pricing Model and the security market line Wilson holds a portfolio that invests equally in three stocks (WA = WB = wc = 1/3). Each stock is described in the Stock Beta 0.5 1.0 2.0 Standard Deviation 23% 38% 45% Expected Return 7.5% 12.0% 14.0% C An analyst has used market- and firm-specific information to generate expected return estimates for...
Options
1) is more than; equals; is less than
2 and 3) Overvalued; in equilibrium; undervalued
6. The Capital Asset Pricing Model and the security market line Wilson holds a portfolio that invests equally in three stocks (WA = WB = wc = 1/3). Each stock is described in the Stock Beta 0.5 1.0 2.0 Standard Deviation 23% 38% 45% Expected Return 7.5% 12.0% 14.0% C An analyst has used market- and firm-specific information to generate expected return estimates for...
 Keith holds a portfolio that is invested equally in three stocks (WD following table: WA w 1/3). Each stock is described in the Stock Beta Standard Deviation Expected Return DET 0.7 AIL 1.0 INO 1.6 25% 38% 34% 8.0% 10.0% 13.5% An analyst has used market- and firm-specific information to make expected return estimates for each stock. The analyst's expected return estimates may or may not equal the stocks' required returns. The risk-free rate [Rr] is 6%, and the market...
 Keith holds a portfolio that is invested equally in three stocks (wp = WA = WI = 1/3). Each stock is described in the following table: Expected Return Standard Deviation 25% 8.0% Stock DET AIL INO Beta 0.7 1.0 1.6 38% 10.0% 34% 13.5% An analyst has used market and firm-specific information to make expected return estimates for each stock. The analyst's expected return estimates may or may not equal the stocks' required returns. The risk-free rate (TRF) is 6%,...
 Keith holds a portfolio that is invested equally in three stocks (wd = wa = W1 = 1/3). Each stock is described in the following table: Stock Beta Expected Return Standard Deviation 25% DET 0.7 8.0% AIL 1.0 38% 10.0% INO 1.6 34% 13.5% An analyst has used market- and firm-specific information to make expected return estimates for each stock. The analyst's expected return estimates may or may not equal the stocks' required returns. The risk-free rate [TRF) is 6%,...
 Keith holds a portfolio that is invested equally in three stocks (wp = WA - wy - 1/3). Each stock is described in the following table: Standard Deviation Expected Return Beta 0.7 1.0 25% Stock DET AIL INO 8.09 38% 10.0% 1.6 34% 13.54 An analyst has used market and firm specific information to make expected return estimates for each stock. The analyst's expected return estimates may or may not equal the stocks' required returns. The risk-free rate [ ]...
 9. The Capital Asset Pricing Model and the security market line Keith holds a portfolio that is invested equally in three stocks (WD = WA = WI = 1/3). Each stock is described in the following table: Stock Beta Standard Deviation Expected Return DET 0.7 25% 8.0% AIL 1.0 38% 10.0% INO 1.6 13.5% 34% An analyst has used market- and firm-specific information to make expected return estimates for each stock. The analyst's expected return estimates may or may not...
 Wilson holds a portfolio that invests equally in three stocks (WAWBWc following table: 1/3). Each stock is described in the Stock Beta Standard Deviation Expected Return A 0.5 23% 38% 45% 7.5% 12.0% 14.0% C 2.0 An analyst has used market- and firm-specific information to generate expected return estimates for each stock. The analyst's expected return estimates may or may not equal the stocks' required returns. You've also determined that the risk-free rate [Rr] is 4%, and the market risk...
 1/3). Each stock is described in the Wilson holds a portfolio that invests equally in three stocks (WA = WB Wc following table: Stock Beta Standard Deviation Expected Return A 0.5 23% 7.5% B 1.0 38% 12.0% C 2.0 45% 14.0% An analyst has used market and firm-specific information to generate expected return estimates for each stock. The analyst's expected return estimates may or may not equal the stocks' required returns. You've also determined that the risk-free rate (TRF) is...
 Wilson holds a portfolio that invests equally in three stocks (WA = WB = wc = 1/3). Each stock is described in the following table: Stock Beta Expected Return 0.5 Standard Deviation 23% 38% 7.5% 12.0% B C 1.0 2.0 45% 14.0% An analyst has used market and firm-specific information to generate expected return estimates for each stock. The analyst's expected return estimates may or may not equal the stocks' required returns. You've also determined that the risk-free rate (TRF)...
 Please help with the graph. Where do I plot?
For the bottom question, the options are as follows.
1. equals, is more than, is less than.
2. in equilibrium, undervalued, overvalued.
3. in equilibrium, undervalued, overvalued.
Keith holds a portfolio that is invested equally in three stocks (wD = wA = w-1/3). Each stock is described in the following table Stock Beta Standard Deviation Expected Return DET 0.7 AIL 1.0 INO 1.6 25% 38% 34% 8.0% 10.0% 13.5% An analyst...
Please help with the graph. Where do I plot?
For the bottom question, the options are as follows.
1. equals, is more than, is less than.
2. in equilibrium, undervalued, overvalued.
3. in equilibrium, undervalued, overvalued.
Keith holds a portfolio that is invested equally in three stocks (wD = wA = w-1/3). Each stock is described in the following table Stock Beta Standard Deviation Expected Return DET 0.7 AIL 1.0 INO 1.6 25% 38% 34% 8.0% 10.0% 13.5% An analyst...
 Options
1) is more than; equals; is less than
2 and 3) Overvalued; in equilibrium; undervalued
6. The Capital Asset Pricing Model and the security market line Wilson holds a portfolio that invests equally in three stocks (WA = WB = wc = 1/3). Each stock is described in the Stock Beta 0.5 1.0 2.0 Standard Deviation 23% 38% 45% Expected Return 7.5% 12.0% 14.0% C An analyst has used market- and firm-specific information to generate expected return estimates for...
Options
1) is more than; equals; is less than
2 and 3) Overvalued; in equilibrium; undervalued
6. The Capital Asset Pricing Model and the security market line Wilson holds a portfolio that invests equally in three stocks (WA = WB = wc = 1/3). Each stock is described in the Stock Beta 0.5 1.0 2.0 Standard Deviation 23% 38% 45% Expected Return 7.5% 12.0% 14.0% C An analyst has used market- and firm-specific information to generate expected return estimates for...
Most questions answered within 3 hours.
-
What assumption are we making about ratings e.g., that ratings
are important in motivating poor performers...
asked 5 seconds from now -
You’ve observed the following returns on Crash-n-Burn Computer’s
stock over the past five years: 11 percent,...
asked 1 minute ago -
In which of the following cases is the displacement's
magnitude half the distance traveled? a. 10...
asked 22 minutes ago -
(InputMismatchException) and (ArrayIndexOutOfBoundsException):
Using the two arrays shown below, write a program that prompts the
user...
asked 17 minutes ago -
A basketball of mass m = 630 g rolls off the hoop's rim, falls
from a...
asked 37 minutes ago -
What is the activity [A] of Na+ in a .05M solution of NaCl at
25C? You...
asked 37 minutes ago -
You own a bond portfolio worth $41,000. You estimate that your
portfolio has an average YTM...
asked 46 minutes ago -
Assume a binomial probability distribution with n=40 and π=0.26.
Compute the following:
A.) The Mean and...
asked 51 minutes ago -
A 2.1-cm-tall object is 19.2 cm to the left of a lens with focal
length of...
asked 54 minutes ago -
In
EXCEL VBA:
How would I manage to do this in VBA?
The assignment is in...
asked 1 hour ago -
what is the statistical probability of 2 caucasians
having identical STR profiles
asked 1 hour ago -
A wheel with a radius of 0.5m starts to rotate from rest and
reaches full speed...
asked 1 hour ago