


Homework Answers
1. In the market for television .As the price of television falls , quantity demanded of television would increase. This would be shown as the downward movement along the demand curve .

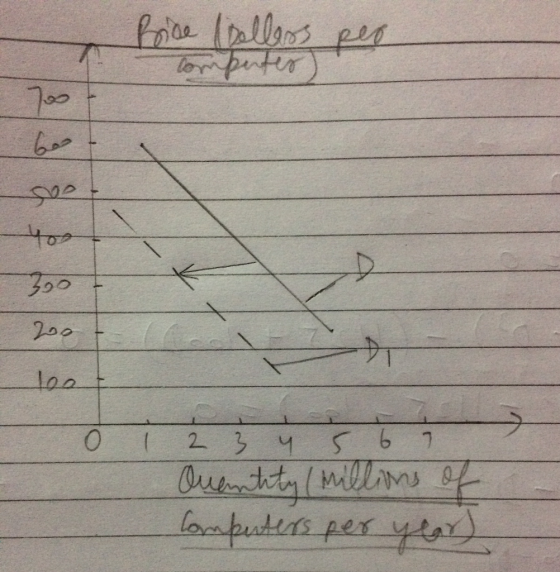
2. Computers are a normal good. Then , if income decreases , demand for computers decreases. Therefore, demand curve for computers will shift to the left.
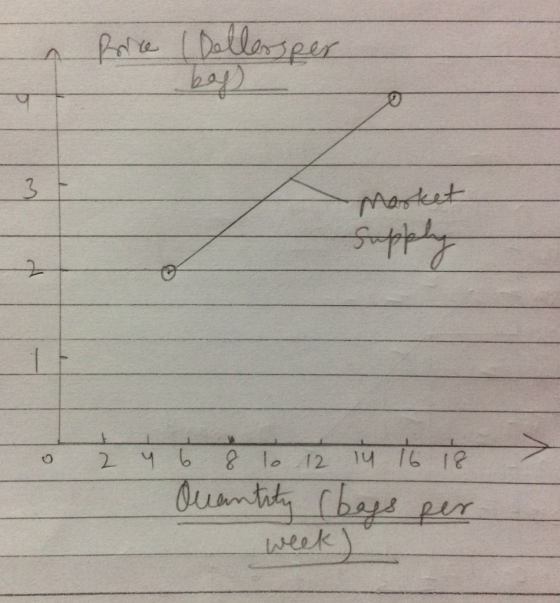
3. Market supply is the sum of individual supply at the given market price.
When P=$8, Barb supply = 3 bags of candy and Gill supply= 2 bags of candy . So, market supply= (3+2)= 5 bags.
When P=$4, Barb supply= 9 bags of candy and Gill supply = 6 bags of candy . So, market supply = (9+6)=15 bags.
By plotting this we get the market supply as shown below:
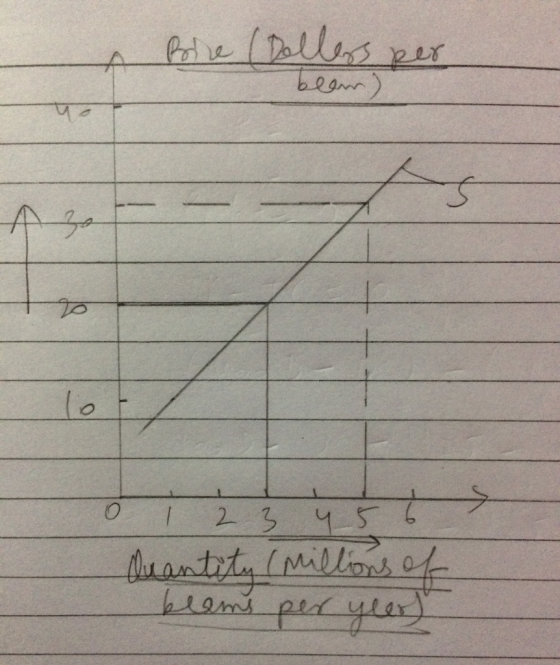
4. In the market for timber beams . As the price of timber rises, quantity supplied of timber increases, this is shown by the upward movement along the supply curve.
Add Answer to:
In the market for televisions, the price of a television falls and nothing else changes. Price...
Consider the table above. If the price in the market is initially set at $2, what...
Consider the table above. If the price in the market is initially set at $2, what is the result in the market, and what will eventually have to happen to move the market to equilibrium? a. Shortage, price increase b. Shortage, price decrease c. Surplus, price increase d. Surplus, price decrease Suppose a market is initially in equilibrium. Then a change occurs and the equilibrium price decreases while the equilibrium quantity increases. What change occurred in the market to cause...
7. Suppose that at a price of $70 the quantity supplied in a market is 10...
 7. Suppose that at a price of $70 the quantity supplied in a market is 10 units, and at a price of s80 th e quantity supplied in the market is 15 unit. If we use this information to create a linear supply equation, what will that equation be? b. P-50+ 2Qs Suppose that college tuition is higher this year than last year and that more students are enrolled in college this year than last year. Based on this information,...
Name: Student ID 1) Draw the supply curve and demand curve to illustrate the market for...
 Name: Student ID 1) Draw the supply curve and demand curve to illustrate the market for Netflix subscriptions for each of the following parts a, b, and e. Label the supply curve S, and the demand curve D. Mark the initial equilibrium point , with an initial equilibrium price of Pand equilibrium quantity of Qi. a) Illustrate the effect of Netflix signing an exclusivity deal to stream popular anime. If the demand curve shifts, label the new demand curve D....
Please help me with my econ homework? 19. Related to the Economics in Practice Market for...
 Please help me with my econ homework?
19. Related to the Economics in Practice Market for Brown Rice The growing popularty of quinoa has had an impact on the market for brown rice. With its higher fiber, protein, and iron content, quinoa is replacing brown rice asa staple food for many health-conscious individuals. Draw a supply and demand graph that shows how this increase in demand for quinoa has affected the market for brown rice 1.) Using the line drawing...
Please help me with my econ homework?
19. Related to the Economics in Practice Market for Brown Rice The growing popularty of quinoa has had an impact on the market for brown rice. With its higher fiber, protein, and iron content, quinoa is replacing brown rice asa staple food for many health-conscious individuals. Draw a supply and demand graph that shows how this increase in demand for quinoa has affected the market for brown rice 1.) Using the line drawing...
Other things remain unchanged, the market demand curve for a particular product is expected to shift leftwards when the price of that product declines.
Other things remain unchanged, the market demand curve for a particular product is expected to shift leftwards when the price of that product declines.Question 1 options:TrueFalseQuestion 2Other things remain equal, which of the following factors causes the market supply curve of Blue-ray players to shift leftwards?Question 2 options:The costs of producing a single Blue-ray player increases.The number of firms selling Blue-ray players increases.The sellers are expecting the price of Blue-ray players to decline in the soon future.Non of the above...
The graph on the right shows a labor market in equilibrium. Using the graph, demonstrate the...
 The graph on the right shows a labor market in equilibrium. Using the graph, demonstrate the impact of a decrease in the wage rate to $6 per hour. Assume all other factors in the economy are constant. Labor supply curve 1.) Using either the line drawing tool or the arrow drawing tool, illustrate the impact on labor demand of a decrease in the wage rate to $6 per hour. (Use the line drawing tool to illustrate a shift in demand...
Consider the market for wheat, depicted in the figure to the right Suppose a price floor...
 Consider the market for wheat, depicted in the figure to the right Suppose a price floor of government is imposed by the As a result of the price floor there is a of wheat Compared with the market clearing equilibrium, is the price floor efficient? What are represents the loss in efficiency in terms of consumer and producer surplus resulting from the price floor? Use the triangle drawing tool to shade in deadweight loss Label this shaded area Deadweight Loss...
Question 1 Other things remain unchanged, the market demand curve for a particular...
Question 1 Other things remain unchanged, the market demand curve for a particular expected to shift leftwards when the price of that product declines. . True False Question 2 Other things remain equal, which of the following factors causes the market supply curve of Blue-ray players to shift leftwards? The costs of producing a single Blue-ray player increases. The number of firms selling Blue-ray players increases. The sellers are expecting the price of Blue-ray players to decline in the soon future. Non of the above factors causes the...
3. Draw a supply and demand diagram. Label each axis, the demand curve, the supply curve,...
 3. Draw a supply and demand diagram. Label each axis, the demand curve, the supply curve, and the equilibrium price and quantity a. Show the impact of an increase in supply. Label the new curve, the new equilibrium price, and the new equilibrium quantity b. Did the equilibrium price increase, decrease, or stay the same? c. Did the equilibrium quantity increase, decrease, or stay the same? 4. Draw a supply and demand diagram. Label each axis, the demand curve, the...
The figure to the right depicts the bond market. Show what will happen to interest rates...
 The figure to the right depicts the bond market. Show what will happen to interest rates if prices in the bond market become more volatile. 1. Using the line drawing tool, show the effect of this shock on the bond market. Properly label your line, 2. Using the point drawing tool, indicate the new equilibrium bond price and quantity. Label the point 2. Carefully follow the instructions above, and only draw the required objects. The effect of this shock will...
 7. Suppose that at a price of $70 the quantity supplied in a market is 10 units, and at a price of s80 th e quantity supplied in the market is 15 unit. If we use this information to create a linear supply equation, what will that equation be? b. P-50+ 2Qs Suppose that college tuition is higher this year than last year and that more students are enrolled in college this year than last year. Based on this information,...
 Name: Student ID 1) Draw the supply curve and demand curve to illustrate the market for Netflix subscriptions for each of the following parts a, b, and e. Label the supply curve S, and the demand curve D. Mark the initial equilibrium point , with an initial equilibrium price of Pand equilibrium quantity of Qi. a) Illustrate the effect of Netflix signing an exclusivity deal to stream popular anime. If the demand curve shifts, label the new demand curve D....
 Please help me with my econ homework?
19. Related to the Economics in Practice Market for Brown Rice The growing popularty of quinoa has had an impact on the market for brown rice. With its higher fiber, protein, and iron content, quinoa is replacing brown rice asa staple food for many health-conscious individuals. Draw a supply and demand graph that shows how this increase in demand for quinoa has affected the market for brown rice 1.) Using the line drawing...
Please help me with my econ homework?
19. Related to the Economics in Practice Market for Brown Rice The growing popularty of quinoa has had an impact on the market for brown rice. With its higher fiber, protein, and iron content, quinoa is replacing brown rice asa staple food for many health-conscious individuals. Draw a supply and demand graph that shows how this increase in demand for quinoa has affected the market for brown rice 1.) Using the line drawing...
 The graph on the right shows a labor market in equilibrium. Using the graph, demonstrate the impact of a decrease in the wage rate to $6 per hour. Assume all other factors in the economy are constant. Labor supply curve 1.) Using either the line drawing tool or the arrow drawing tool, illustrate the impact on labor demand of a decrease in the wage rate to $6 per hour. (Use the line drawing tool to illustrate a shift in demand...
 Consider the market for wheat, depicted in the figure to the right Suppose a price floor of government is imposed by the As a result of the price floor there is a of wheat Compared with the market clearing equilibrium, is the price floor efficient? What are represents the loss in efficiency in terms of consumer and producer surplus resulting from the price floor? Use the triangle drawing tool to shade in deadweight loss Label this shaded area Deadweight Loss...
 3. Draw a supply and demand diagram. Label each axis, the demand curve, the supply curve, and the equilibrium price and quantity a. Show the impact of an increase in supply. Label the new curve, the new equilibrium price, and the new equilibrium quantity b. Did the equilibrium price increase, decrease, or stay the same? c. Did the equilibrium quantity increase, decrease, or stay the same? 4. Draw a supply and demand diagram. Label each axis, the demand curve, the...
 The figure to the right depicts the bond market. Show what will happen to interest rates if prices in the bond market become more volatile. 1. Using the line drawing tool, show the effect of this shock on the bond market. Properly label your line, 2. Using the point drawing tool, indicate the new equilibrium bond price and quantity. Label the point 2. Carefully follow the instructions above, and only draw the required objects. The effect of this shock will...
Most questions answered within 3 hours.
-
Synthesis of fructose-2,6-bisphosphate is catalyzed by a
bifunctional enzyme that contains two catalytic domains: PFK2
(kinase...
asked 2 minutes ago -
observation
initial burst volume
total volume titrated to reach end point
what happened to the rise...
asked 4 minutes ago -
Let x1, x2,x3,and x4 be a random sample from
population with normal distribution with mean ?...
asked 18 minutes ago -
A string of mass m and length L is under tension T. The speed of
a...
asked 23 minutes ago -
Look at the descriptions of high sensation seekers in your book.
They look like they would...
asked 24 minutes ago -
Write a method called is1to1 that accepts a map whose keys and
values are strings as...
asked 24 minutes ago -
In a study of self-medication, a simple random sample of 1230
adults completed a survey. The...
asked 34 minutes ago -
You ride a bicycle around on a circular track while
accelerating. The circle has a radius...
asked 32 minutes ago -
I am looking help with these 5 Questions, can you help me,
please
1) Ruth Hu...
asked 39 minutes ago -
Find the center of mass of the Eath-moon
system given:
Radius of Earth = 6.37x10^6
Radius...
asked 1 hour ago -
Using the definition and measurement of GDP as a guide,
evaluate how the use of fiscal...
asked 43 minutes ago -
An overly optimistic sales budget may result in
a. increases in selling prices late in the...
asked 42 minutes ago