
Homework Answers

Add Answer to:
The table below shows the GDP deflator and the CPI over five recent years. By what...
The table below shows the GDP deflator and the CPI over the past five years. By...
 The table below shows the GDP deflator and the CPI over the past five years. By what percentage did prices change between years for each measure? Instructions: Enter your answers as percentages rounded to two decimal places. Year Change in GDP deflator CPI GDP deflator 100 Change in CPI 2015 2016 105 100 104 110 113 2017 2018 2019 2015-2019 112 123 128 122
The table below shows the GDP deflator and the CPI over the past five years. By...
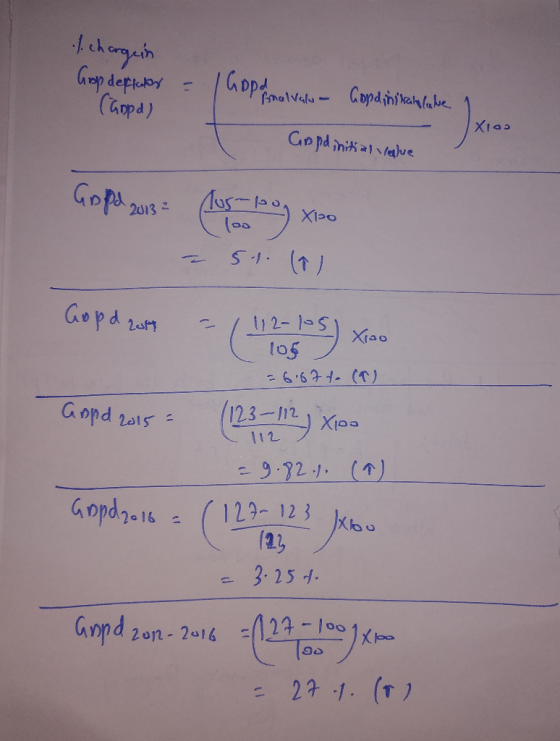
 The table below shows the GDP deflator and the CPI over the past five years. By what percentage did prices change between years for each measure? nstructions: Enter your answers as percentages rounded to one decimal place. Change in GDP Change in CP Year 2005 2006 2007 2008 2009 2005-2009 GDP deflator 100 105 112 123 127 100 104 110 113 120
GDP Inflation Deflator Rate YEAR CPI GDP %GDP | Real GDP | %RGDP (%CPI) |(2015-100) 2012...
 GDP Inflation Deflator Rate YEAR CPI GDP %GDP | Real GDP | %RGDP (%CPI) |(2015-100) 2012 231.2 95.43 1619 2013 234.72 97.11 16785 2014 236.27 98.94 17522 2015 237.83 100.00 18219 2016 242.7 01.09 1870 2017 247.91 103.02 19485 1. Calculate the annual inflation rate using the CPI. 2. Calculate the annual GDP growth rate using the GDP. 3. Explain how the inflation rate and the GDP growth have been moved. 4. Calculate the real GDP using GDP deflator by...
Based on the table below, calculate nominal GDP, real GDP, the GDP deflator, and the inflation...
 Based on the table below, calculate nominal GDP, real GDP, the GDP deflator, and the inflation rate in each year and fill in the missing parts of the table. Use 2014 as the base year. Instructions: Round nominal and real GDP values to two decimal places. Round GDP deflator and inflation rate values to the nearest whole number. Price of Quantity of Price of orange ($) Quantity of oranges 700 beach balls beach ball Nominal GDP ($) Real GDP ($)...
13. The accompanying table contains two price indexes for the years 2014, 2015, and 2016: the...
 13. The accompanying table contains two price indexes for the years 2014, 2015, and 2016: the GDP deflator and the CPI. For each price index, calculate the inflation rate from 2014 to 2015 and from 2015 to 2016. (Note: The GDP deflator has a base year of 2007 and the CPI has a base year of 2002.) Year GDP deflator CPI 2014 113.1 125.2 2015 112.2 126.6 2016 112.9 128.4
Fill in the missing data in the following table. Year Nominal GDP GDP deflator Real GDP...
 Fill in the missing data in the following table. Year Nominal GDP GDP deflator Real GDP $ 2012 $220000 100.0 2013 $215,000 110.0 2014 $260,000 $220,000 2015 $290,000 $ 123.0 2016 $240,000 130.0
The table below shows six years of hypothetical CPI values for the United States. Using the...
 The table below shows six years of hypothetical CPI values for the United States. Using the information in the table, compute the annual inflation rate. Instructions: Round your answers to two decimal places. CPI Values and Inflation Inflation Rate (percent) СРІ Year 2009 2010 1.64 % 2011 208.04 214.07 221.90 228.10 233.69 246.69 2012 2013 2014
Given the following data on the table calculate: the GDP deflator for each year 2014,2015 and...
Given the following data on the table calculate: the GDP deflator for each year 2014,2015 and 2016. Show clearly your calculations (10%) the inflation rate between 2014-2015 and 2015-2016. Show clearly your calculations (10%) (€ million) 2014 2015 2016 Nominal GDP 4,650,000 4,930,000 6,310,000 Real GDP 5,800,000 6,550,000 7,300,200
Based on the table below, calculate nominal GDP, real GDP, the GDP deflator, and the inflation...
 Based on the table below, calculate nominal GDP, real GDP, the GDP deflator, and the inflation rate in each year and fill in the missing parts of the table. Use 2014 as the base year. Instructions: Round nominal and real GDP values to two decimal places. Round GDP deflator and inflation rate values to the nearest whole number.
I need 5,6, and 7 GDP Inflation DtorGDP GDP | %GDP | Real GDP | %RGDP...
 I need 5,6, and 7
GDP Inflation DtorGDP GDP | %GDP | Real GDP | %RGDP 160p Rate YEAR CP (%CPI) Defator 2012-1 L00 |(2015-100) 2012 231.22 95.43 16197 le19 7 2013 234.72 522/0. yor103-6789 o4.738S 17522|4.34%|17 2014| 2015 237.830.ph 201ej 236.27|О.loby. | | 98.94 100.00 18219 242.79 2-08 y.| 24791| 2.11 % 1870102 (o8y1870 101.0 201 103.02 19485 1. Calculate the annual inflation rate using the CPI 2. Calculate the annual GDP growth rate using the GDP 3. Explain...
I need 5,6, and 7
GDP Inflation DtorGDP GDP | %GDP | Real GDP | %RGDP 160p Rate YEAR CP (%CPI) Defator 2012-1 L00 |(2015-100) 2012 231.22 95.43 16197 le19 7 2013 234.72 522/0. yor103-6789 o4.738S 17522|4.34%|17 2014| 2015 237.830.ph 201ej 236.27|О.loby. | | 98.94 100.00 18219 242.79 2-08 y.| 24791| 2.11 % 1870102 (o8y1870 101.0 201 103.02 19485 1. Calculate the annual inflation rate using the CPI 2. Calculate the annual GDP growth rate using the GDP 3. Explain...
 The table below shows the GDP deflator and the CPI over the past five years. By what percentage did prices change between years for each measure? Instructions: Enter your answers as percentages rounded to two decimal places. Year Change in GDP deflator CPI GDP deflator 100 Change in CPI 2015 2016 105 100 104 110 113 2017 2018 2019 2015-2019 112 123 128 122
 The table below shows the GDP deflator and the CPI over the past five years. By what percentage did prices change between years for each measure? nstructions: Enter your answers as percentages rounded to one decimal place. Change in GDP Change in CP Year 2005 2006 2007 2008 2009 2005-2009 GDP deflator 100 105 112 123 127 100 104 110 113 120
 GDP Inflation Deflator Rate YEAR CPI GDP %GDP | Real GDP | %RGDP (%CPI) |(2015-100) 2012 231.2 95.43 1619 2013 234.72 97.11 16785 2014 236.27 98.94 17522 2015 237.83 100.00 18219 2016 242.7 01.09 1870 2017 247.91 103.02 19485 1. Calculate the annual inflation rate using the CPI. 2. Calculate the annual GDP growth rate using the GDP. 3. Explain how the inflation rate and the GDP growth have been moved. 4. Calculate the real GDP using GDP deflator by...
 Based on the table below, calculate nominal GDP, real GDP, the GDP deflator, and the inflation rate in each year and fill in the missing parts of the table. Use 2014 as the base year. Instructions: Round nominal and real GDP values to two decimal places. Round GDP deflator and inflation rate values to the nearest whole number. Price of Quantity of Price of orange ($) Quantity of oranges 700 beach balls beach ball Nominal GDP ($) Real GDP ($)...
 13. The accompanying table contains two price indexes for the years 2014, 2015, and 2016: the GDP deflator and the CPI. For each price index, calculate the inflation rate from 2014 to 2015 and from 2015 to 2016. (Note: The GDP deflator has a base year of 2007 and the CPI has a base year of 2002.) Year GDP deflator CPI 2014 113.1 125.2 2015 112.2 126.6 2016 112.9 128.4
 Fill in the missing data in the following table. Year Nominal GDP GDP deflator Real GDP $ 2012 $220000 100.0 2013 $215,000 110.0 2014 $260,000 $220,000 2015 $290,000 $ 123.0 2016 $240,000 130.0
 The table below shows six years of hypothetical CPI values for the United States. Using the information in the table, compute the annual inflation rate. Instructions: Round your answers to two decimal places. CPI Values and Inflation Inflation Rate (percent) СРІ Year 2009 2010 1.64 % 2011 208.04 214.07 221.90 228.10 233.69 246.69 2012 2013 2014
 I need 5,6, and 7
GDP Inflation DtorGDP GDP | %GDP | Real GDP | %RGDP 160p Rate YEAR CP (%CPI) Defator 2012-1 L00 |(2015-100) 2012 231.22 95.43 16197 le19 7 2013 234.72 522/0. yor103-6789 o4.738S 17522|4.34%|17 2014| 2015 237.830.ph 201ej 236.27|О.loby. | | 98.94 100.00 18219 242.79 2-08 y.| 24791| 2.11 % 1870102 (o8y1870 101.0 201 103.02 19485 1. Calculate the annual inflation rate using the CPI 2. Calculate the annual GDP growth rate using the GDP 3. Explain...
I need 5,6, and 7
GDP Inflation DtorGDP GDP | %GDP | Real GDP | %RGDP 160p Rate YEAR CP (%CPI) Defator 2012-1 L00 |(2015-100) 2012 231.22 95.43 16197 le19 7 2013 234.72 522/0. yor103-6789 o4.738S 17522|4.34%|17 2014| 2015 237.830.ph 201ej 236.27|О.loby. | | 98.94 100.00 18219 242.79 2-08 y.| 24791| 2.11 % 1870102 (o8y1870 101.0 201 103.02 19485 1. Calculate the annual inflation rate using the CPI 2. Calculate the annual GDP growth rate using the GDP 3. Explain...
Most questions answered within 3 hours.
-
4. Without doing any calculations, predict whether the observed
∆T would increase, decrease or remain the...
asked 54 minutes ago -
Based on the range, which of the following sets of scores has
the greatest variability? 3,...
asked 2 hours ago -
Ripples in a pond travel at a velocity of 3 m/s with one peak
passing a...
asked 1 hour ago -
A man stands on the roof of a building of height 13.0 mm and
throws a...
asked 1 hour ago -
The extent to which assets are financed by borrowed funds and
other liabilities is indicated by:...
asked 2 hours ago -
Explain in detail
Germany is the fifth largest economy
explain what goods and services Germany specializes...
asked 3 hours ago -
The density of platinum is 21.45 g/mL. If a cube of platinum
with a mass of...
asked 3 hours ago -
Accounts Receivable
Sales
A/R Posting
Extended Sales Invoice
Packing Slip
Compare invoice to packing slip 2...
asked 3 hours ago -
Michaella, age 23, is a full-time law student and is claimed by
her parents as a...
asked 3 hours ago -
Why are polymers not typically casted into products?
asked 3 hours ago -
When rolling a die 129 times, what is the probability of rolling
a 6 no more...
asked 3 hours ago -
4. A call option currently sells for $7.75. It has a strike
price of $85 and...
asked 3 hours ago