There are infinite number of possible points of production on a production possibility curve, explain how...
There are infinite number of possible points of production on a production possibility curve, explain how a “market economy” decides to choose one production point on a PPC.
Homework Answers
Ans:
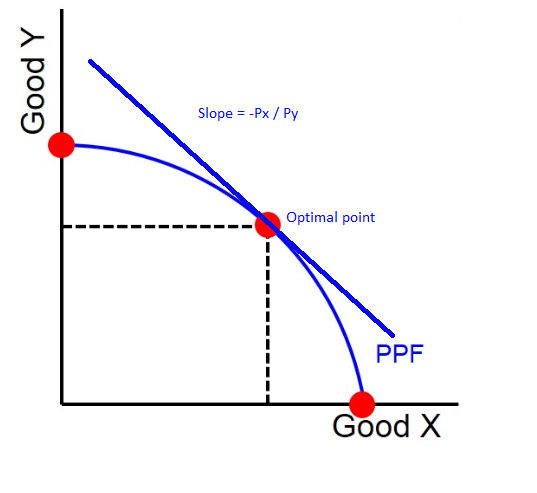
PPC shows different combinations of 2 goods that can be produced using given set of inputs when fully employed.
There exists revenue curve as well.
Suppose price of good X is Px and that of good Y is Py, then total revenue that can be earned is:
PxX + PyY.
Purpose of production is to earn maximum revenue.
Hence, optimal point is where the revenue line is tangent to PPC.
In other words, slope of PPC = slope of line
Or,
MRTS = -Px/Py.
If you are satisfied with the answer, please provide a positive rating. Feel free to comment in case of queries.
Have a nice day ahead!
Add Answer to:
There are infinite number of possible points of production on a
production possibility curve, explain how...
They go together 4. Design a production possibility curve. Show and explain how it demonstrates opportunity...
 They go together
4. Design a production possibility curve. Show and explain how it demonstrates opportunity cost and scarcity. Make this curve reflect the principle of increasing marg inal opportunity costs. In addition to the graph, show the actual numbers you are graphing in a schedule 15 pts 5. Demonstrate on your PPC with a point of operation that the economy is operating below potential. 4 pts
They go together
4. Design a production possibility curve. Show and explain how it demonstrates opportunity cost and scarcity. Make this curve reflect the principle of increasing marg inal opportunity costs. In addition to the graph, show the actual numbers you are graphing in a schedule 15 pts 5. Demonstrate on your PPC with a point of operation that the economy is operating below potential. 4 pts
1525 11. Discuss the most significant factors that affect demand for goods and services. 12. What...
 1525 11. Discuss the most significant factors that affect demand for goods and services. 12. What causes for a demand curve to shift to right or to left? When do we move from one point to another on a demand curve, what causes it? 13. Demonstrate graphically how a horizontal summation of individual demand curves provides a "market demand curve." 14. Discuss the most important factors/variables that affect supply of goods and services. 15. Explain the difference between moving on...
Suppose that before trade opens up, Brazil is at a point on its production possibility curve...
Suppose that before trade opens up, Brazil is at a point on its production possibility curve (PPC) where it produces 20 apples and 20 cars. Once trade opens up, the price of a car becomes two apples. In response, Brazil moves along its PPC to a new point where it is producing 30 cars and 10 apples. Is Brazil now better off? Explain.
Please Answer Question number two A) (10 points) Draw the aggregate production possibility curve of fruit production i...
 Please Answer Question number two
A) (10 points) Draw the aggregate production possibility curve of fruit production in Washington State. Label carefully. Assume it is linear for each company. B) (5 points) Using one company as an example, explain what the slope of a producer's PPF means. C) (10 points) Suppose apples are $1 per pound and grapes are $5 per pound. Show how many grapes and apples each country will produce (a) graphically and (b) write your answer numerically....
Please Answer Question number two
A) (10 points) Draw the aggregate production possibility curve of fruit production in Washington State. Label carefully. Assume it is linear for each company. B) (5 points) Using one company as an example, explain what the slope of a producer's PPF means. C) (10 points) Suppose apples are $1 per pound and grapes are $5 per pound. Show how many grapes and apples each country will produce (a) graphically and (b) write your answer numerically....
The ________ production points on a production possibility curve are the points along and inside the...
The ________ production points on a production possibility curve are the points along and inside the production possibility frontier. A) attainable B) unattainable C) productively efficient D) allocatively efficient
17. Match the statement affecting the production possibility curve with its graphical representation: New technology affecting...
17. Match the statement affecting the production possibility curve with its graphical representation: New technology affecting both industries A. inward shift of the curve B. a movement along the curve C. outward shift of the curve D. A rotation of the curve E. Point outside the curve F. point inside the curve 18. Match the statement affecting the production possibility curve with its graphical representation: An increase in consumer spending on one good but no change in consumer's income A....
In this assignment, you will demonstrate your ability to draw a simple production possibilities curve given...
 In this assignment, you will demonstrate your ability to draw a simple production possibilities curve given data on the quantity of one input (labor) and the amount of labor required to produce each of two outputs (guns and butter). You should also be able to identify the opportunity cost of one good in terms of the other as the slope of the PPC. You will explain your analysis of the figures to explain why it's not possible to produce combinations...
In this assignment, you will demonstrate your ability to draw a simple production possibilities curve given...
In this assignment, you will demonstrate your ability to draw a simple production possibilities curve given data on the quantity of one input (labor) and the amount of labor required to produce each of two outputs (guns and butter). You should also be able to identify the opportunity cost of one good in terms of the other as the slope of the PPC. You will explain your analysis of the figures to explain why it’s not possible to produce combinations...
-Jueet 3.4: Production Possibilities Curves using the given production possibility curve as a starting points show...
 -Jueet 3.4: Production Possibilities Curves using the given production possibility curve as a starting points show the result of each of the following. e as a starting point, correctly label the graph and There is an increase in unemployment in a nation using all of its resources and producing 20 boats (Horizontal) and 0 cheese balls (Vertical) or 60 cheese balls and 0 boats. 10 . 00 in technol
6. A point that is located inside the production possibility curve is: Efficient b. Unattainable Equally...
 6. A point that is located inside the production possibility curve is: Efficient b. Unattainable Equally efficient as all other points d. inefficient C
 They go together
4. Design a production possibility curve. Show and explain how it demonstrates opportunity cost and scarcity. Make this curve reflect the principle of increasing marg inal opportunity costs. In addition to the graph, show the actual numbers you are graphing in a schedule 15 pts 5. Demonstrate on your PPC with a point of operation that the economy is operating below potential. 4 pts
They go together
4. Design a production possibility curve. Show and explain how it demonstrates opportunity cost and scarcity. Make this curve reflect the principle of increasing marg inal opportunity costs. In addition to the graph, show the actual numbers you are graphing in a schedule 15 pts 5. Demonstrate on your PPC with a point of operation that the economy is operating below potential. 4 pts
 1525 11. Discuss the most significant factors that affect demand for goods and services. 12. What causes for a demand curve to shift to right or to left? When do we move from one point to another on a demand curve, what causes it? 13. Demonstrate graphically how a horizontal summation of individual demand curves provides a "market demand curve." 14. Discuss the most important factors/variables that affect supply of goods and services. 15. Explain the difference between moving on...
 Please Answer Question number two
A) (10 points) Draw the aggregate production possibility curve of fruit production in Washington State. Label carefully. Assume it is linear for each company. B) (5 points) Using one company as an example, explain what the slope of a producer's PPF means. C) (10 points) Suppose apples are $1 per pound and grapes are $5 per pound. Show how many grapes and apples each country will produce (a) graphically and (b) write your answer numerically....
Please Answer Question number two
A) (10 points) Draw the aggregate production possibility curve of fruit production in Washington State. Label carefully. Assume it is linear for each company. B) (5 points) Using one company as an example, explain what the slope of a producer's PPF means. C) (10 points) Suppose apples are $1 per pound and grapes are $5 per pound. Show how many grapes and apples each country will produce (a) graphically and (b) write your answer numerically....
 In this assignment, you will demonstrate your ability to draw a simple production possibilities curve given data on the quantity of one input (labor) and the amount of labor required to produce each of two outputs (guns and butter). You should also be able to identify the opportunity cost of one good in terms of the other as the slope of the PPC. You will explain your analysis of the figures to explain why it's not possible to produce combinations...
 -Jueet 3.4: Production Possibilities Curves using the given production possibility curve as a starting points show the result of each of the following. e as a starting point, correctly label the graph and There is an increase in unemployment in a nation using all of its resources and producing 20 boats (Horizontal) and 0 cheese balls (Vertical) or 60 cheese balls and 0 boats. 10 . 00 in technol
 6. A point that is located inside the production possibility curve is: Efficient b. Unattainable Equally efficient as all other points d. inefficient C
Most questions answered within 3 hours.
-
. Suppose a discrete random variable has probability
distribution
P(x) = .2 if x = 0...
asked 4 minutes ago -
Why do organizations decline? What steps can top
management take to halt, decline, and restore organizational...
asked 18 minutes ago -
Under the influence of its drive force, a snowmobile is moving
at a constant velocity along...
asked 32 minutes ago -
What mechanisms Drive speciation??
(I.e. what was Dawins theory on the orgin of species, and how...
asked 1 hour ago -
The manager at a car assembly plant believes that the mean
assembly time for a car...
asked 2 hours ago -
Which of the following is true of electron capture?
A) It decreases the nuclide's mass number...
asked 4 hours ago -
Assuming an efficiency of 43.10%, calculate the actual yield of
magnesium nitrate formed from 114.9 g...
asked 4 hours ago -
The highly pathogenic bacterium Clostridium
perfringens causes gangrene, a disease that results in the
destruction of...
asked 6 hours ago -
In the context of situation analysis, which of the following is
a category for analysis in...
asked 6 hours ago -
In a study of the gas phase decomposition of sulfuryl chloride
at 600 K SO2Cl2(g)SO2(g) +...
asked 6 hours ago -
75 g of 2-propanol (C3H8O) and 25 g of pentane are mixed in a
200 mL...
asked 6 hours ago -
The 2800-turn coil in a dc motor has an area per turn of 1.1 ×
10-2...
asked 6 hours ago