91 169 305 330 335 389 393 394 402 410 420 449 452 455 459 465...
|
91 |
169 |
305 |
330 |
335 |
389 |
393 |
394 |
|
402 |
410 |
420 |
449 |
452 |
455 |
459 |
465 |
|
468 |
471 |
472 |
474 |
475 |
479 |
481 |
486 |
|
487 |
505 |
508 |
509 |
511 |
512 |
517 |
519 |
|
530 |
537 |
|
|
|
|
|
|
Homework Answers


91 169 305 330 335 389 393 394 402 410 420 449 452 455 459 465...
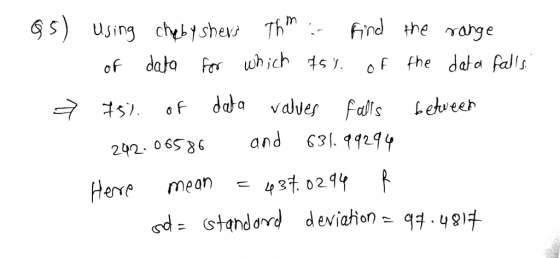
91 169 305 330 335 389 393 394 402 410 420 449 452 455 459 465 468 471 472 474 475 479 481 486 487 505 508 509 511 512 517 519 530 537 1. Construct a frequency distribution table using 10 classes. Start the lower limit with 91. 2. Using Chebyshev’s Theorem, find the range of data for which 75% of the data falls.
91 169 305 330 335 389 393 394 402 410 420 449 452 455 459 465...
91 169 305 330 335 389 393 394 402 410 420 449 452 455 459 465 468 471 472 474 475 479 481 486 487 505 508 509 511 512 517 519 530 537 For this data set is 44.6 the correct class limit to use even if the upper limit ends in 537.9?
91 169 305 330 335 389 393 394 402 410 420 449 452 455 459 465...
91 169 305 330 335 389 393 394 402 410 420 449 452 455 459 465 468 471 472 474 475 479 481 486 487 505 508 509 511 512 517 519 530 537 Using the data from the table, complete the following. Show all work for full credit! 1. Find the mean, median, and mode. 2. Find the 5-number summary and IQR. 3. Construct a frequency distribution table using 10 classes. Start the lower limit with 91. 4. Construct...
Project Number 9 Statistical analysis of radiation data recorded by an ionization chamber Project Number 9...
 Project Number 9 Statistical analysis of radiation data recorded by an ionization chamber Project Number 9 Statistical analysis of radiation data recorded by an ionization chamber In this project, you are required to statistically analyze the data of radiation dose recorded by an ionization chamber experimentally in the research lab. Background of the problem: For measuring the radiation dose delivered to a body by a given radiation beam, an ionization chamber (detector) is used. An ionization chamber is made up...
 Project Number 9 Statistical analysis of radiation data recorded by an ionization chamber Project Number 9 Statistical analysis of radiation data recorded by an ionization chamber In this project, you are required to statistically analyze the data of radiation dose recorded by an ionization chamber experimentally in the research lab. Background of the problem: For measuring the radiation dose delivered to a body by a given radiation beam, an ionization chamber (detector) is used. An ionization chamber is made up...
Most questions answered within 3 hours.
-
in a perfectly elastic collision what is the velocity of ball A
if the original direction...
asked 4 minutes ago -
PLEASE ANSWER ALL
1) The pressure of the atmosphere decreases with increasing
altitude in the
Choose...
asked 18 minutes ago -
A simple random sample of 25,000 individuals are surveyed in
order to determine the prevalence of...
asked 20 minutes ago -
People who do very detailed work close up, such as jewelers,
often can see objects clearly...
asked 23 minutes ago -
14 years ago, Blue Lake Corp. issued 30 year to maturity
zero-coupon bonds with a par...
asked 14 minutes ago -
Warnerwoods Company uses a perpetual inventory system. It
entered into the following purchases and sales transactions...
asked 11 minutes ago -
Equivalent Units of Conversion Costs
The Rolling Department of Oak Ridge Steel Company had 6,842 tons...
asked 15 minutes ago -
what does the concept of "core competence" mean? why
is this concept important? How would you...
asked 18 minutes ago -
__________ is a type of visualization that is linked to strategy
and used within a formal...
asked 19 minutes ago -
A national magazine stated that at most,12% of millennials
have a pool membership. Formulate an appropriate...
asked 31 minutes ago -
Can
you provide the mechanism for enamine hydrolysis. Any example will
work, thank you.
asked 40 minutes ago -
Three of the compounds have ionic bonds (difference in
electronegativity is greater or equal to 2,...
asked 33 minutes ago