
Homework Answers
Add Answer to:
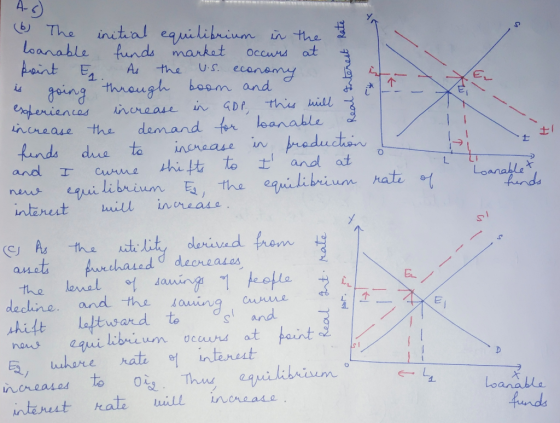
Answer only B and C thanks
6. For each scenario, complete the loanable funds graph and...
The demand for loanable funds decreases while the supply simultaneously increases. This would cause the equilibrium...
The demand for loanable funds decreases while the supply simultaneously increases. This would cause the equilibrium 1)quantity of loanable funds to increase, but the effect on the equilibrium interest rate would be uncertain. 2)interest rate to decrease, but the new equilibrium quantity would be uncertain. 3)quantity of loanable funds to increase and the equilibrium interest rate to decrease. 4)quantity of loanable funds to decrease and the equilibrium interest rate to increase. 5)interest rate to increase, but the new equilibrium quantity...
6. (Problem 6) An economy is facing the inflationary gap shown in the accompanying diagram. Aggregate...
 6. (Problem 6) An economy is facing the inflationary gap shown in the accompanying diagram. Aggregate price level LRAS SRAS Real GDP Potential —YpY output To eliminate the gap, should the central bank use expansionary or contractionary monetary policy? How will the interest rate, investment spending, consumer spending, real GDP, and the aggregate price level change as monetary policy closes the inflationary gap? The central bank can use contractionary monetary policy. The interest rate will rise, which would encourage a...
Table shows the initial market for loanable funds in Econland. There is no Ricardo-Barro effect. If...
 Table shows the initial market for loanable funds in Econland. There is no Ricardo-Barro effect. If the government moves from a balanced budget to a surplus of $20 billion, the new equilibrium has a real interest rate of and quantity of loanable funds traded equal to Real interest rate Demand for Loanable Funds Supply of Loanable Funds (5 billions) (5 billions) 3% 160 40 4% 140 60 5% 120 80 100 100 80 120 8% 140 6% 7% A.5 percent;...
3. For each of the following, draw the loanable funds market and use it to determine...
3. For each of the following, draw the loanable funds market and use it to determine what happens to the equilibrium interest rate. a. Household time preferences increase (they become less patient). b. Demographic composition of the society shifts towards people ages 24-44. c. Technological breakthrough increases productivity of physical capital. d. Decrease in the business optimism and confidence.
Consider the US loanable funds market. For each of the following separate scenarios, draw a graph...
Consider the US loanable funds market. For each of the following separate scenarios, draw a graph to show how the equilibrium interest rate and equilibrium quantity of loanable funds changes. Banks impose more regulations and make it more difficult for firms to borrow. Productivity of machines decreases. Households are less confident about the economy, they expect a recession will come soon. If households expect a recession will come soon, will this increase the natural rate of unemployment? Explain. A recession...
1. When the government increases spending by issuing more bonds, it causes: a) nations currency to...
1. When the government increases spending by issuing more bonds, it causes: a) nations currency to appreciate b)exports increase c)interest rates decrease d)demand for loanable funds decrease e)decreases merchandise trade deficit 2. When the Fed decreases money supply to combat inflation, it cuases: a)the price of the U.S. dollar to decrease b) capital to flow out of the US c)an increase in the merchandise trade deficit d)an increase in private spending e) a decrease in the interest rates 3. Which...
1. What occurs during a negative demand shock? Output increases and the price level decreases. Output...
1. What occurs during a negative demand shock? Output increases and the price level decreases. Output and price level decrease. Output and price level increase. Output decreases and the price level increases. 2. In the equation of exchange, the term P × Q is the same as: the money supply. nominal GDP. national income. real GDP. 3. Expansionary monetary policy shifts the _____ curve to the _____. AD; right SRAS; left SRAS; right AD; left 4. The Taylor rule suggests...
The following graph shows the market for loanable funds. For each of the given scenarios, adjust the appropriate curve on the graph to help you complete the questions that follow.
 5. The market for loanable funds and government policy The following graph shows the market for loanable funds. For each of the given scenarios, adjust the appropriate curve on the graph to help you complete the questions that follow. Treat each scenario separately by resetting the graph to its original state before examining the effect of each individual scenario. (Note: You will not be graded on any changes you make to the graph.) Scenario 1: Individual Retirement Accounts (IRAs) allow people to...
3) For each of the cases below, draw a well-labeled graph of the loanable funds market...
 3) For each of the cases below, draw a well-labeled graph of the loanable funds market and indicate the changes in the market due to the following a) Poor economic outcome leads to unfavorable investment environment b) Federal government decreases the tax rate without changing total deficit c) Federal government decides to increase government spending and hence increases the deficit.
The following graph shows the market for loanable funds. For each of the given scenarios, adjust...
 The following graph shows the market for loanable funds. For
each of the given scenarios, adjust the appropriate curve on the
graph to help you complete the questions that follow. Treat each
scenario separately by resetting the graph to its original state
before examining the effect of each individual scenario.
Demand Supply Supply INTEREST RATE (Percent) Demand LOANABLE FUNDS (Billions of dollars) Scenario 1: Individual Retirement Accounts (IRAS) allow people to shelter some of their income from taxation. Suppose the...
The following graph shows the market for loanable funds. For
each of the given scenarios, adjust the appropriate curve on the
graph to help you complete the questions that follow. Treat each
scenario separately by resetting the graph to its original state
before examining the effect of each individual scenario.
Demand Supply Supply INTEREST RATE (Percent) Demand LOANABLE FUNDS (Billions of dollars) Scenario 1: Individual Retirement Accounts (IRAS) allow people to shelter some of their income from taxation. Suppose the...
 6. (Problem 6) An economy is facing the inflationary gap shown in the accompanying diagram. Aggregate price level LRAS SRAS Real GDP Potential —YpY output To eliminate the gap, should the central bank use expansionary or contractionary monetary policy? How will the interest rate, investment spending, consumer spending, real GDP, and the aggregate price level change as monetary policy closes the inflationary gap? The central bank can use contractionary monetary policy. The interest rate will rise, which would encourage a...
 Table shows the initial market for loanable funds in Econland. There is no Ricardo-Barro effect. If the government moves from a balanced budget to a surplus of $20 billion, the new equilibrium has a real interest rate of and quantity of loanable funds traded equal to Real interest rate Demand for Loanable Funds Supply of Loanable Funds (5 billions) (5 billions) 3% 160 40 4% 140 60 5% 120 80 100 100 80 120 8% 140 6% 7% A.5 percent;...
 3) For each of the cases below, draw a well-labeled graph of the loanable funds market and indicate the changes in the market due to the following a) Poor economic outcome leads to unfavorable investment environment b) Federal government decreases the tax rate without changing total deficit c) Federal government decides to increase government spending and hence increases the deficit.
 The following graph shows the market for loanable funds. For
each of the given scenarios, adjust the appropriate curve on the
graph to help you complete the questions that follow. Treat each
scenario separately by resetting the graph to its original state
before examining the effect of each individual scenario.
Demand Supply Supply INTEREST RATE (Percent) Demand LOANABLE FUNDS (Billions of dollars) Scenario 1: Individual Retirement Accounts (IRAS) allow people to shelter some of their income from taxation. Suppose the...
The following graph shows the market for loanable funds. For
each of the given scenarios, adjust the appropriate curve on the
graph to help you complete the questions that follow. Treat each
scenario separately by resetting the graph to its original state
before examining the effect of each individual scenario.
Demand Supply Supply INTEREST RATE (Percent) Demand LOANABLE FUNDS (Billions of dollars) Scenario 1: Individual Retirement Accounts (IRAS) allow people to shelter some of their income from taxation. Suppose the...
Most questions answered within 3 hours.
-
The US Census Bureau gathered data regarding yearly gas sales
for residents of different states. Wyoming...
asked 14 minutes ago -
A person in a casino decides to play blackjack until he loses a
game, but he...
asked 17 minutes ago -
mode field diameter (MFD) is an important parameter in
characterizing single mode fibre properties which takes...
asked 8 minutes ago -
Question 4: What is the significance of those strange
“36.79%” and “63.21%” numbers the procedure? That...
asked 14 minutes ago -
Rules of implementation!:
You may NOT modify any of the files except Expression.java in
ANY way....
asked 16 minutes ago -
Arbitration of disputes under the purview of "lemon laws" under
state statute is:
not required by...
asked 29 minutes ago -
Describe three pieces of evidence that mitochondria and evolved
from symbiotic mutualisms between a eukaryote (or...
asked 37 minutes ago -
An AM transmitter with a carrier power of 20 kW is connected to
a 50 Ω...
asked 45 minutes ago -
JAVA
Beginnings of a paper-rock-scissors game.
Paper-rock-scissors is a game often used to make decisions.
There...
asked 50 minutes ago -
Consider a concept learning example of 5 attributes. Attributes
can take one of (5,3,2,2,6) values respectively....
asked 56 minutes ago -
Red light of wavelength 675 nm is incident on a slit of width
4.56 × 10⁻⁶...
asked 1 hour ago -
An object 4.0 mm high is on the optical axis of two lenses with
focal lengths...
asked 1 hour ago