
Homework Answers


Add Answer to:
1.71 Potatoes. A quality product is one that is consistent and has very little variability in...
A quality product is one that is consistent and has very little variability in its characteristics....
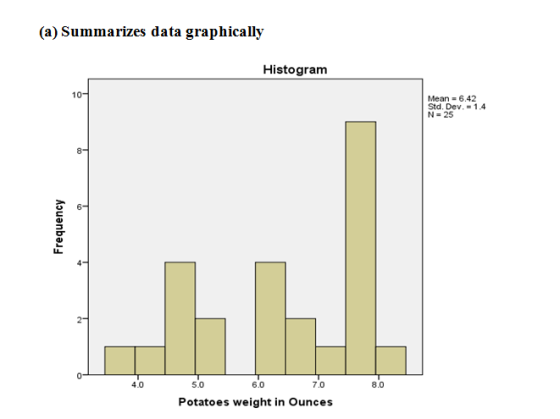
 A quality product is one that is consistent and has very little variability in its characteristics. Controariability can be more difficult with agricultural products than with those that are manufactured. The following table gives the weights, in ounces, of the 25 potatoes sold in a 10-pound bag. 7.7 7.9 8.1 6.9 6.7 7.8 7.9 7.8 7.5 7.8 7.0 4.8 7.6 6.3 4.8 4.7 4.8 6.2 6.1 5.2 4.4 7.8 5.1 6.1 3.8 (a) Make a stemplot for these data. (Split...
4.3 Analysis Assignment #4 Note 1: all assignments moving forward must adhere to the appropriate Six Ste...
 4.3 Analysis Assignment #4 Note 1: all assignments moving forward must adhere to the appropriate Six Step Process (SSP). As our study materials have specified, the SSP has 3 versions. Version 1 is to be used for all t-tests; for all correlation analyses and Version 3 is be used for all regression analyses. Note 2: The data sets for Q1, Q2 and Q3 below can be downloaded here. Week 4 Analysis Assignments.xlsx Q1: (30 points) Complete the following data analysis:...
 A quality product is one that is consistent and has very little variability in its characteristics. Controariability can be more difficult with agricultural products than with those that are manufactured. The following table gives the weights, in ounces, of the 25 potatoes sold in a 10-pound bag. 7.7 7.9 8.1 6.9 6.7 7.8 7.9 7.8 7.5 7.8 7.0 4.8 7.6 6.3 4.8 4.7 4.8 6.2 6.1 5.2 4.4 7.8 5.1 6.1 3.8 (a) Make a stemplot for these data. (Split...
 4.3 Analysis Assignment #4 Note 1: all assignments moving forward must adhere to the appropriate Six Step Process (SSP). As our study materials have specified, the SSP has 3 versions. Version 1 is to be used for all t-tests; for all correlation analyses and Version 3 is be used for all regression analyses. Note 2: The data sets for Q1, Q2 and Q3 below can be downloaded here. Week 4 Analysis Assignments.xlsx Q1: (30 points) Complete the following data analysis:...
Most questions answered within 3 hours.
-
Water at gauge pressure of 3.8 atmospheres at street level
enters an office building at 0.60...
asked 9 minutes ago -
Quick question, I want to know how to convert decimal numbers to
binary number, when i...
asked 30 minutes ago -
You found out that now you are going to receive payments of
$8,500 for the next...
asked 34 minutes ago -
17.
Technician A says that leaking components are usually repaired
rather than replaced. Technician B says...
asked 35 minutes ago -
A) An Operon is:?
1- A gene that affect another gene
transcription.
2. A gene coding...
asked 42 minutes ago -
When opening a file, use this method to determine whether a file
exists before you attempt...
asked 46 minutes ago -
Sales total $300,000 when variable costs total $180,000 and
fixed costs are $60,000. Breakeven sales total:...
asked 53 minutes ago -
1)
To calculate the depth of a water well, an explorer drops a stone and with...
asked 50 minutes ago -
0.429-g sample of gas occupies 125 mL at 60. cm of Hg and 25°C.
The molar...
asked 52 minutes ago -
The
pH of a 0.90M solution of boric acid (H3BO3) is measured to be
4.64.
Calculate...
asked 1 hour ago -
on april 10, a company acquired land valued at $58,000 in
exchange for 1,000 shares of...
asked 1 hour ago -
Is
ampicillin or solvents (such as acetone) more effective at killing
off bacteria, in general? Explain...
asked 1 hour ago