Please show all your work, write equations clearly, plug in values properly, and comment on all steps.
Homework Answers
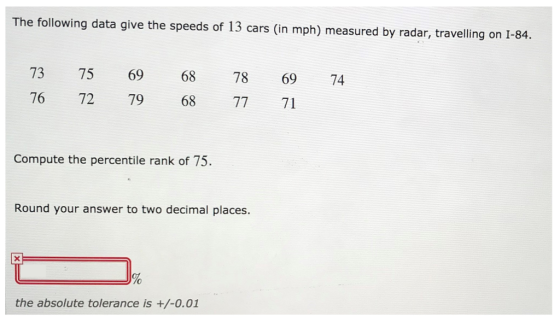
The sample can be re written as
68,68,69,69,71,72,73,74,75,76,77,78,79
The percentile rank is calculated as
Where K= Position of the variable in ascending order, and here the position of 75 is 8
n= no of sample=13
Add Answer to:
Please show all your work, write equations clearly, plug in
values properly, and comment on all...
Please show all your work, write equations clearly, plug in values properly, and comment on all...
 Please show all your work, write equations clearly, plug in
values properly, and comment on all steps.
The following data give the speeds of 13 cars (in mph) measured by radar, travelling on 1-84. 73 75 69 68 78 69 74 76 72 79 68 77 71 Calculate the value of the 35th percentile. Enter the exact answer. mph. exact number, no tolerance
Please show all your work, write equations clearly, plug in
values properly, and comment on all steps.
The following data give the speeds of 13 cars (in mph) measured by radar, travelling on 1-84. 73 75 69 68 78 69 74 76 72 79 68 77 71 Calculate the value of the 35th percentile. Enter the exact answer. mph. exact number, no tolerance
Consider the below matrixA, which you can copy and paste directly into Matlab.
Problem #1: Consider the below matrix A, which you can copy and paste directly into Matlab. The matrix contains 3 columns. The first column consists of Test #1 marks, the second column is Test # 2 marks, and the third column is final exam marks for a large linear algebra course. Each row represents a particular student.A = [36 45 75 81 59 73 77 73 73 65 72 78 65 55 83 73 57 78 84 31 60 83...
PRINTER VERSION 8th ed Chapter 03, Section 3.5, Problem 092b The following data give the numbers...
 PRINTER VERSION 8th ed Chapter 03, Section 3.5, Problem 092b The following data give the numbers of computer keyboards assembled at the Twentieth Century Electronics Company for a sample of 25 days. 66 67 68 71 72 72 70 71 7777 78 78 81 79 75 76 76 77 69 69 73 73 73 74 75 Determine the (approximate) value of the 53rd percentile. Round your answer to the nearest integer. 1878 81 79 75 76 76 77 606 The...
Current Attempt in Progress The following data give the speeds of 13 cars, measured by radar,...
 Current Attempt in Progress The following data give the speeds of 13 cars, measured by radar, traveling on 1-84. 73 75 76 72 70 79 68 65 78 70 74 76 71 Find the values of the three quartiles and the interquartile range. Qı = i Q2 = i 03 = 1 IQR = i Hint
Use the Grouped Distribution method for the following exercise (see Self-Test 2-4 for detailed instructions), rounding...
Use the Grouped Distribution method for the following exercise (see Self-Test 2-4 for detailed instructions), rounding each answer to the nearest whole number. Using the frequency distribution below (scores on a statistics exam taken by 80 students), determine:ion 1 of the preliminary test (scores on a statistics exam taken by 80 students), determine: 68 84 75 82 68 90 62 88 76 93 73 79 88 73 60 93 71 59 85 75 61 65 75 87 74 62 95...
Use the accompanying data set on the pulse rates (in beats per minute) of males to...
Use the accompanying data set on the pulse rates (in beats per minute) of males to complete parts (a) and (b) below. LOADING... Click the icon to view the pulse rates of males. a. Find the mean and standard deviation, and verify that the pulse rates have a distribution that is roughly normal. The mean of the pulse rates is 71.871.8 beats per minute. (Round to one decimal place as needed.) The standard deviation of the pulse rates is 12.212.2...
Please show all work step by step. thank you! Please read the direction in every problem....
 Please show all work step by step. thank you!
Please read the direction in every problem. Show all your work here. (Round probabilities to 4 decimals.) 1. A student earned grades of 84, 78, 84, and 72 on her four regular tests. She earned a grade of 78 on the final exam and 86 on her class projects. Her combined homework grade was 87. The four regular tests count for 40% of the course grade, the final exam counts for...
Please show all work step by step. thank you!
Please read the direction in every problem. Show all your work here. (Round probabilities to 4 decimals.) 1. A student earned grades of 84, 78, 84, and 72 on her four regular tests. She earned a grade of 78 on the final exam and 86 on her class projects. Her combined homework grade was 87. The four regular tests count for 40% of the course grade, the final exam counts for...
1. Forecast demand for Year 4. a. Explain what technique you utilized to forecast your demand....
 1. Forecast demand for Year 4.
a. Explain what technique you utilized to forecast your
demand.
b. Explain why you chose this technique over others.
Year 3 Year 1 Year 2 Actual Actual Actual Forecast Forecast Forecast Demand Demand Demand Week 1 52 57 63 55 66 77 Week 2 49 58 68 69 75 65 Week 3 47 50 58 65 80 74 Week 4 60 53 58 55 78 67 57 Week 5 49 57 64 76 77...
1. Forecast demand for Year 4.
a. Explain what technique you utilized to forecast your
demand.
b. Explain why you chose this technique over others.
Year 3 Year 1 Year 2 Actual Actual Actual Forecast Forecast Forecast Demand Demand Demand Week 1 52 57 63 55 66 77 Week 2 49 58 68 69 75 65 Week 3 47 50 58 65 80 74 Week 4 60 53 58 55 78 67 57 Week 5 49 57 64 76 77...
Please show all your work, write equations clearly, plug in values properly, and comment on all...
 Please show all your work, write equations clearly, plug in
values properly, and comment on all steps.
The following table gives the frequency distribution of the number of hours spent per week on activities that involve sports and/or exercise by a sample of 400A The numbers are consistent with the summary results from the Bureau of Labor Statistics' American Time Use Survey (www.bls.gov). mericans. Hours per Week Number of People 0 to less than 3.5 36 3.5 to less than...
Please show all your work, write equations clearly, plug in
values properly, and comment on all steps.
The following table gives the frequency distribution of the number of hours spent per week on activities that involve sports and/or exercise by a sample of 400A The numbers are consistent with the summary results from the Bureau of Labor Statistics' American Time Use Survey (www.bls.gov). mericans. Hours per Week Number of People 0 to less than 3.5 36 3.5 to less than...
 Please show all your work, write equations clearly, plug in
values properly, and comment on all steps.
The following data give the speeds of 13 cars (in mph) measured by radar, travelling on 1-84. 73 75 69 68 78 69 74 76 72 79 68 77 71 Calculate the value of the 35th percentile. Enter the exact answer. mph. exact number, no tolerance
Please show all your work, write equations clearly, plug in
values properly, and comment on all steps.
The following data give the speeds of 13 cars (in mph) measured by radar, travelling on 1-84. 73 75 69 68 78 69 74 76 72 79 68 77 71 Calculate the value of the 35th percentile. Enter the exact answer. mph. exact number, no tolerance
 PRINTER VERSION 8th ed Chapter 03, Section 3.5, Problem 092b The following data give the numbers of computer keyboards assembled at the Twentieth Century Electronics Company for a sample of 25 days. 66 67 68 71 72 72 70 71 7777 78 78 81 79 75 76 76 77 69 69 73 73 73 74 75 Determine the (approximate) value of the 53rd percentile. Round your answer to the nearest integer. 1878 81 79 75 76 76 77 606 The...
 Current Attempt in Progress The following data give the speeds of 13 cars, measured by radar, traveling on 1-84. 73 75 76 72 70 79 68 65 78 70 74 76 71 Find the values of the three quartiles and the interquartile range. Qı = i Q2 = i 03 = 1 IQR = i Hint
 Please show all work step by step. thank you!
Please read the direction in every problem. Show all your work here. (Round probabilities to 4 decimals.) 1. A student earned grades of 84, 78, 84, and 72 on her four regular tests. She earned a grade of 78 on the final exam and 86 on her class projects. Her combined homework grade was 87. The four regular tests count for 40% of the course grade, the final exam counts for...
Please show all work step by step. thank you!
Please read the direction in every problem. Show all your work here. (Round probabilities to 4 decimals.) 1. A student earned grades of 84, 78, 84, and 72 on her four regular tests. She earned a grade of 78 on the final exam and 86 on her class projects. Her combined homework grade was 87. The four regular tests count for 40% of the course grade, the final exam counts for...
 1. Forecast demand for Year 4.
a. Explain what technique you utilized to forecast your
demand.
b. Explain why you chose this technique over others.
Year 3 Year 1 Year 2 Actual Actual Actual Forecast Forecast Forecast Demand Demand Demand Week 1 52 57 63 55 66 77 Week 2 49 58 68 69 75 65 Week 3 47 50 58 65 80 74 Week 4 60 53 58 55 78 67 57 Week 5 49 57 64 76 77...
1. Forecast demand for Year 4.
a. Explain what technique you utilized to forecast your
demand.
b. Explain why you chose this technique over others.
Year 3 Year 1 Year 2 Actual Actual Actual Forecast Forecast Forecast Demand Demand Demand Week 1 52 57 63 55 66 77 Week 2 49 58 68 69 75 65 Week 3 47 50 58 65 80 74 Week 4 60 53 58 55 78 67 57 Week 5 49 57 64 76 77...
 Please show all your work, write equations clearly, plug in
values properly, and comment on all steps.
The following table gives the frequency distribution of the number of hours spent per week on activities that involve sports and/or exercise by a sample of 400A The numbers are consistent with the summary results from the Bureau of Labor Statistics' American Time Use Survey (www.bls.gov). mericans. Hours per Week Number of People 0 to less than 3.5 36 3.5 to less than...
Please show all your work, write equations clearly, plug in
values properly, and comment on all steps.
The following table gives the frequency distribution of the number of hours spent per week on activities that involve sports and/or exercise by a sample of 400A The numbers are consistent with the summary results from the Bureau of Labor Statistics' American Time Use Survey (www.bls.gov). mericans. Hours per Week Number of People 0 to less than 3.5 36 3.5 to less than...
Most questions answered within 3 hours.
-
What mechanisms Drive speciation??
(I.e. what was Dawins theory on the orgin of species, and how...
asked 1 hour ago -
The manager at a car assembly plant believes that the mean
assembly time for a car...
asked 2 hours ago -
Which of the following is true of electron capture?
A) It decreases the nuclide's mass number...
asked 3 hours ago -
Assuming an efficiency of 43.10%, calculate the actual yield of
magnesium nitrate formed from 114.9 g...
asked 4 hours ago -
The highly pathogenic bacterium Clostridium
perfringens causes gangrene, a disease that results in the
destruction of...
asked 6 hours ago -
In the context of situation analysis, which of the following is
a category for analysis in...
asked 6 hours ago -
In a study of the gas phase decomposition of sulfuryl chloride
at 600 K SO2Cl2(g)SO2(g) +...
asked 6 hours ago -
75 g of 2-propanol (C3H8O) and 25 g of pentane are mixed in a
200 mL...
asked 6 hours ago -
The 2800-turn coil in a dc motor has an area per turn of 1.1 ×
10-2...
asked 6 hours ago -
Draw a combinational logic circuit diagram with a symbol inside
the box for two I/P of...
asked 6 hours ago -
The cliché we use quite a lot in finance is: there is a need to
maximize...
asked 6 hours ago -
In class we discussed the addition of HCl to alpha pinene. Would
you expect one or...
asked 6 hours ago