1. The average amount parents and children spent per child on back-to-school clothes in Autumn 2010...
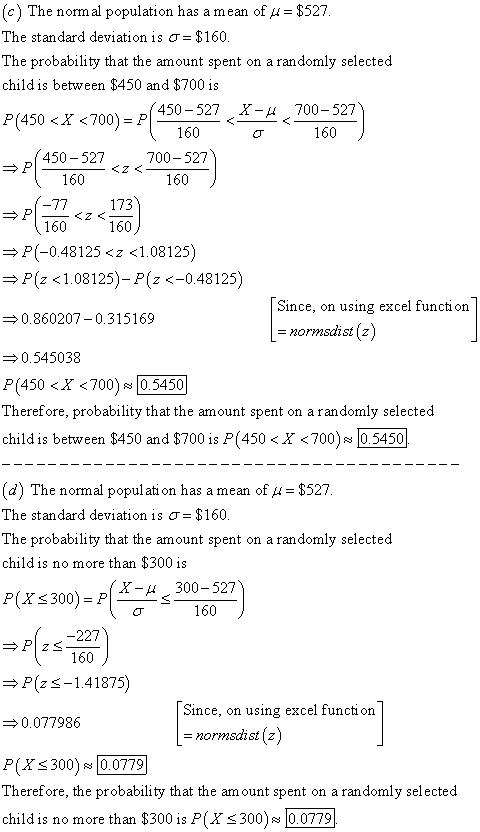
1. The average amount parents and children spent per child on back-to-school clothes in Autumn 2010 was $527. Assume the standard deviation is $160 and that the amount spent is normally distributed.
What is the probability that the amount spent on a randomly selected child is more than $700? (Round to four decimal places)
What is the probability that the amount spent on a randomly selected child is less than $100? (Round to four decimal places)
What is the probability that the amount spent on a randomly selected child is between $450 and $700? (Round to four decimal places)
What is the probability that the amount spent on a randomly selected child is no more than $300? (Round to four decimal places)
2.
The average stock price for companies making up the S&P 500 is $30, and the standard deviation is $8.20. Assume the stock prices are normally distributed.
What is the probability a company will have a stock price of at least $40? (Round to four decimal places)
What is the probability a company will have a stock price no higher than $20? (Round to four decimal places)
How high does a stock price have to be to put a company in the top 10%? (Round to two decimal places)
3.
Last year the American worker spent an average of 77 hours logged on to the Inter-net while at work. Assume the times are normally distributed and that the standard deviation is 20 hours.
What is the probability a randomly selected worker spent fewer than 50 hours logged on to the Internet? (Round to four decimal places)
What is the probability a worker spent more than 100 hours logged on to the Internet? (Round to four decimal places)
A person is classified as a heavy user if he or she is in the upper 20% of usage. How many hours must a worker have logged on to the Internet to be considered a heavy user? (Round to two decimal places)
4.
According to the Bureau of Labor Statistics, the average weekly pay for a U.S. production worker was $441.84. Assume that available data indicate that production worker wages were normally distributed with a standard deviation of $90.
What is the probability that a worker earned between $400 and $500? (Round to four decimal places)
How much did a production worker have to earn to be in the top 20% of wage earners? (Round to two decimal places)
For a randomly selected production worker, what is the probability the worker earned less than $250 per week? (Round to four decimal places)
5.
The time needed to complete a final examination in a particular college course is normally distributed with a mean of 80 minutes and a standard deviation of 10 minutes. Answer the following questions.
What is the probability of completing the exam in one hour or less? (Round to four decimal places)
What is the probability that a student will complete the exam in more than 60 minutes but less than 75 minutes? (Round to four decimal places)
Assume that the class has 60 students and that the examination period is 90 minutes in length. How many students do you expect will be unable to complete the exam in the allotted time? (Round to the nearest whole number)
6.
The average ticket price for a Washington Redskins football game was $81.89 for the season. With the additional costs of parking, food. drinks, and souvenirs, the average cost for a family of four to attend a game totaled $442.54. Assume the normal distribution applies and that the standard deviation is $65.
What is the probability that a family of four will spend more than $400? (Round to four decimal places)
What is the probability that a family of four will spend $300 or less? (Round to four decimal places)
What is the probability that a family of four will spend between $400 and $500? (Round to four decimal places)
Homework Answers

Add Answer to:
1. The average amount parents and children spent per child on
back-to-school clothes in Autumn 2010...
3. Last year the American worker spent an average of 77 hours logged on to the...
3. Last year the American worker spent an average of 77 hours logged on to the Inter-net while at work. Assume the times are normally distributed and that the standard deviation is 20 hours. What is the probability a randomly selected worker spent fewer than 50 hours logged on to the Internet? (Round to four decimal places) What is the probability a worker spent more than 100 hours logged on to the Internet? (Round to four decimal places) A person...
The population mean amount spent per child on back-to-school clothes last fall was $427 with a...
The population mean amount spent per child on back-to-school clothes last fall was $427 with a population standard deviation of $160. Assume amounts spent were normally distributed. What is the probability that the amount spent on a child is between $449.40 and $727.80?
Part 1. Case 6-2b: Internet Usage 2003 In January 2003, the American worker spent an average...
Part 1. Case 6-2b: Internet Usage 2003 In January 2003, the American worker spent an average of 77 hours logged on to the Internet while at work. Assume the times are normally distributed and that the standard deviation is 20 hours. Refer to Case 6-2b: Internet Usage 2003 Which of the following statements about Internet usage by American workers is most probably FALSE? 1. A worker must have logged on to the Internet at least 123.60 hours to be in...
One year consumers spent an average of $22 on a meal at a resturant. Assume that...
One year consumers spent an average of $22 on a meal at a resturant. Assume that the amount spent on a resturant meal is normally distributed and that the standard deviation is $5. Complete parts (a) through (c) below. a. What is the probability that a randomly selected person spent more than $23? P(Xgreater than$23)equals 0.4207 (Round to four decimal places as needed.) b. What is the probability that a randomly selected person spent between $8 and $21? P($8less thanXless...
One year consumers spent an average of $21 on a meal at a restaurant. Assume that...
One year consumers spent an average of $21 on a meal at a restaurant. Assume that the amount spent on a restaurant meal is normally distributed and that the standard deviation is $4. Complete parts (a) through (c) below. a. What is the probability that a randomly selected person spent more than $ 22? P(X> $22 )=___________________ (Round to four decimal places as needed.) b. What is the probability that a randomly selected person spent between $11 and $ 19?P($11<X<...
A study found that the mean amount of time cars spent in drive-throughs of a certain...
 A study found that the mean amount of time cars spent in drive-throughs of a certain fast-food restaurant was 138.6 seconds. Assuming drive-through times are normally distributed with a standard deviation of 30 seconds, complete parts (a) through (d) below. Click here to view the standard normal distribution table (page 1). Click here to view the standard normal distribution table (page 2). (a) What is the probability that a randomly selected car will get through the restaurant's drive-through in less...
A study found that the mean amount of time cars spent in drive-throughs of a certain...
 A study found that the mean amount of time cars spent in drive-throughs of a certain fast-food restaurant was 148.9 seconds. Assuming drive-through times are normally distributed with a standard deviation of 24 seconds, complete parts (a) through (d) below. (a) What is the probability that a randomly selected car will get through the restaurant's drive-through in less than 119 seconds? The probability that a randomly selected car will get through the restaurant's drive-through in less than 119 seconds is...
1. According to Consumer Response Annual Report, millennials spent an average of $103 on monthly dining...
1. According to Consumer Response Annual Report, millennials spent an average of $103 on monthly dining in 2016. Let the amount spent on a monthly dining be normally distributed with unknown standard deviation. Assume that the probability of a randomly-selected millennial that spends more than $133 is 10%, and the probability that a randomly-selected millennial that spends less than $97 pounds is 40%. What is the probability that a randomly-selected millennial will spend between $73 and $109 on a monthly...
4. According to the Bureau of Labor Statistics, the average weekly pay for a U.S. production...
4. According to the Bureau of Labor Statistics, the average weekly pay for a U.S. production worker was $441.84. Assume that available data indicate that production worker wages were normally distributed with a standard deviation of $90. What is the probability that a worker earned between $400 and $500? (Round to four decimal places) How much did a production worker have to earn to be in the top 20% of wage earners? (Round to two decimal places) For a randomly...
The mean amount spent by a family of four on food per month is $490 with...
The mean amount spent by a family of four on food per month is $490 with a standard deviation of $78. Assuming that the food costs are normally distributed, what is the probability that a family spends less than $442 per month?
 A study found that the mean amount of time cars spent in drive-throughs of a certain fast-food restaurant was 138.6 seconds. Assuming drive-through times are normally distributed with a standard deviation of 30 seconds, complete parts (a) through (d) below. Click here to view the standard normal distribution table (page 1). Click here to view the standard normal distribution table (page 2). (a) What is the probability that a randomly selected car will get through the restaurant's drive-through in less...
 A study found that the mean amount of time cars spent in drive-throughs of a certain fast-food restaurant was 148.9 seconds. Assuming drive-through times are normally distributed with a standard deviation of 24 seconds, complete parts (a) through (d) below. (a) What is the probability that a randomly selected car will get through the restaurant's drive-through in less than 119 seconds? The probability that a randomly selected car will get through the restaurant's drive-through in less than 119 seconds is...
Most questions answered within 3 hours.
-
A member of the volleyball team spikes the ball. During this
process, she changes the velocity...
asked 1 minute ago -
Are adult gamers less likely to use a gaming console (Xbox,
PlayStation, Wii, etc...) than teen...
asked 54 minutes ago -
The University of
Texas recently reported that 43% of college students aged 18-24
would spend their...
asked 1 hour ago -
The length of stay at a specific emergency department in
Phoenix, Arizona, in 2009 had a...
asked 21 minutes ago -
. Please give the mechanism for this type of problem. Step by
Step
The toxin that...
asked 24 minutes ago -
If you have a 1M stock solution and you want to dilute 1 :10
with water,...
asked 26 minutes ago -
In a load instruction, the effective address is obtained by
A) Retriving the address from a...
asked 26 minutes ago -
Use the following information to answer this question.
Windswept, Inc. 2017 Income Statement ($ in millions)...
asked 27 minutes ago -
A mutual fund salesperson has arranged to call on four people
tomorrow. Based on past experience...
asked 1 hour ago -
Let the RV Y has the pdf
f ( y ) = 6 y ( 1...
asked 1 hour ago -
Question 12
Where should a copy of a private key should be placed so it is...
asked 29 minutes ago -
What is the entropy change to the surroundings when 1 mol of ice
melts in someone's...
asked 49 minutes ago