Question
Please answer the questions and provide the graphs.


Homework Answers
Answer #1
(a)
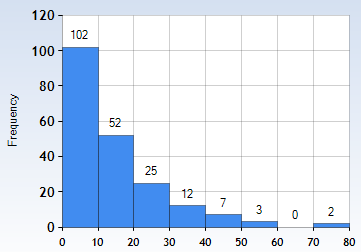
| Class | Frequency | Relative Frequency | Cumulative Frequency | Cumulative Relative Frequency | |
| 0-9.99 | 102 | 0.502 | 102 | 0.502 | |
| 10-19.99 | 52 | 0.256 | 154 | 0.759 | |
| 20-29.99 | 25 | 0.123 | 179 | 0.882 | |
| 30-39.99 | 12 | 0.059 | 191 | 0.941 | |
| 40-49.99 | 7 | 0.034 | 198 | 0.975 | |
| 50-59.99 | 3 | 0.015 | 201 | 0.990 | |
| 60-69.99 | 0 | 0.000 | 201 | 0.990 | |
| 70-79.99 | 2 | 0.010 | 203 | 1.000 | |
| Total | 203 | 1 |
Histogram :
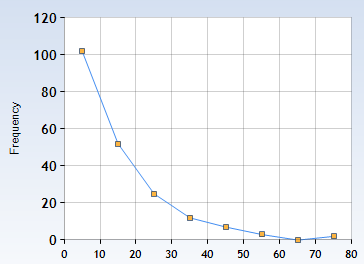
Frequency Polygon :
(b)
Percentage of measurements less than 10 = 102 / 203 = 0.5025 = 50.25%
(c)
Proportion of subjects have measurements greater than equal to 20 = (203 - 154) / 203 = 49 / 203 = 0.2414
(d)
Percentage of measurements between 20 and 49 inclusive = 43 / 203 = 0.2118 = 21.18 %
(e)
Number of measurements greater than 39 = 7 + 3 + 0 + 2 = 12
(f)
Proportion of measurements either less than 10 or greater than 69 = (102 + 2 ) /203 = 0.5123
(g)
Answer would be 5 because 5 is most frequently occurring observation (Mode)
So, 5 has the highest probability of occurring.
Know the answer?
Add Answer to:
Please answer the questions and provide the graphs.
Antibody & Immunohistochemical Methods In a study of...
Not the answer you're looking for?
Ask your own homework help question.
Our experts will answer your question WITHIN MINUTES for Free.
Similar Homework Help Questions
ADVERTISEMENT
Need Online Homework Help?
Ask
a QuestionGet Answers For Free
Most questions answered within 3 hours.
Most questions answered within 3 hours.
ADVERTISEMENT
ADVERTISEMENT
Active Questions
-
You have a 825.3 mL sample of 2.754 M HA (Ka =
4.49⋅10−4). Calculate the pH...
asked 1 hour ago -
The blues made its way into many kinds of music. Eric Clapton,
The Beatles, and Elvis...
asked 3 hours ago -
8. A wave in a string has a wave function given by: y (x, t) =...
asked 2 hours ago -
If you’re standing at the bottom of a hill and asked to evaluate
it while being...
asked 4 hours ago -
1. Which region has taken the lead in the world of
e-waste handling?
a) European Union...
asked 4 hours ago -
A 8.15- g bullet from a 9-mm pistol has a velocity of 366.0 m/s.
It strikes...
asked 6 hours ago -
The outstanding bonds of Alpha Extracts have a yield to maturity
of 7.4 percent and a...
asked 5 hours ago -
The Problem: The Case of the Harmonizing Vacations
Your CEO is exploring partnering with a European...
asked 7 hours ago -
A chemical equation is balanced by adding coefficients in front
of some formulas so that the...
asked 7 hours ago -
From the literature (reference your sources): What are the
lattice parameters of calcite and aragonite? Why...
asked 8 hours ago -
Your system is rejecting the question am asking which is
preceded by a case study. It...
asked 8 hours ago -
3. On January 2, 2000, Larry creates a trust with himself as
trustee. Larry as trustee...
asked 8 hours ago
ADVERTISEMENT