
Homework Answers
Page 1
Page 2

Page 3

Add Answer to:
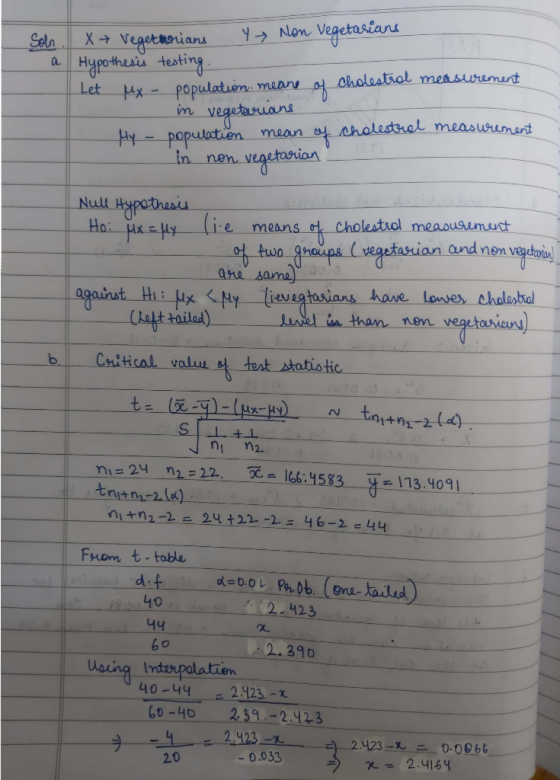
For the following problem: a. State the null and alternative hypotheses b. Determine the critical value...
The mean weight of U.S. men of age 30–39 years old is 191.802 pounds. Using the...
The mean weight of U.S. men of age 30–39 years old is 191.802 pounds. Using the provided sample data file, conduct a one-sample ?-test of a mean to test whether the mean weight of men of age 30–39 years old who smoke daily is lower than 191.802. Calculate the sample mean, x¯, for this data. Give your answer precise to at least one decimal place: Compute the standard deviation, SD, of the sampling distribution of the mean. (Some people call...
Open the data Cars04-HW6&5 and answer questions 13 to 14. 13. Compute the Average, Median, and...
Open the data Cars04-HW6&5 and answer questions 13 to 14. 13. Compute the Average, Median, and Standard Deviation Horsepower column. Which of the following statement is true? (4 points) a. Median < Average < Standard deviation b. Average < Standard deviation c. Standard deviation d. Average < Median < Standard deviation e. Standard Deviation < Average < Median 14. Using 2-standard deviation rule of thumb and the information you obtained from question 13 which of the following is true? Round...
Population 1 Female weights Population 2 male weights 128 190 142 145 130 150 133 127 195 165 166 155 112 155 180 180 180 156 155 188 144 220 140 154 143 200 110 210...
Population 1 Female weights Population 2 male weights 128 190 142 145 130 150 133 127 195 165 166 155 112 155 180 180 180 156 155 188 144 220 140 154 143 200 110 210 160 270 125 250 130 180 150 250 145 240 180 170 175 150 108 155 200 195 151 210 170 155 141 165 200 145 185 190 142 234 125 205 130 151 240 153 160 172 120 200 210 130 220 210...
The weights (in pounds) of 30 participants are recorded before and after a 6 week exercise program. A. Calculate the di...
 The weights (in pounds) of 30 participants are recorded before
and after a 6 week exercise program.
A. Calculate the difference between the before weight and after
weight of all 30 participants, where a negative value represents
losing weight. Then, find the mean difference of weights. (Round
your answer to the nearest hundredth)
B. Next, find the sample standard deviation for the difference
of weights. (Round your answer to the nearest hundredth)
C. The goal is to find the 90%...
The weights (in pounds) of 30 participants are recorded before
and after a 6 week exercise program.
A. Calculate the difference between the before weight and after
weight of all 30 participants, where a negative value represents
losing weight. Then, find the mean difference of weights. (Round
your answer to the nearest hundredth)
B. Next, find the sample standard deviation for the difference
of weights. (Round your answer to the nearest hundredth)
C. The goal is to find the 90%...
Maintaining a healthy weight is important for women’s health. Some physicians recommend being back to your...
Maintaining a healthy weight is important for women’s health. Some physicians recommend being back to your pre-pregnancy weight six months after giving birth. Public health officials are interested in whether this is a realistic goal. Do the women in North Carolina weigh more than their pre-pregnancy weight six months postpartum? In other words, is the six months post-pregnancy weight greater than their pre-pregnancy weight? Use a paired samples t-test to compare pst6wght (variable 1) and prewght (variable 2). This uses...
Bidder Distribution Hub 1 2 3 4 A 190 175 125 230 B 150 235 155...
 Bidder Distribution Hub 1 2 3 4 A 190 175 125 230 B 150 235 155 220 C 210 225 135 260 D 170 185 190 280 E 220 190 140 240 F 270 200 130 260 a. Develop the network of the problem. (1 Marks) b. Formulate the problem as a linear programming problem. (2 Marks) c. Solve assignment that minimizes total cost. (2 Marks)
The data below represents height in inches/weight in pounds. Clearly identify the dependent and independent variables...
The data below represents height in inches/weight in pounds. Clearly identify the dependent and independent variables as well as the domain and range. Choose any two points from the data using different independent variables and use those two points to determine the rate of change (slope). Then, using the dependent data value of -500 as your initial value, write an equation for the linear function model. Predict what you expect at a height of 75". inches/pounds 60" - 105, 110...
Serum Systolic Serum Systolic Serum Systolic Serum Systolic Serum Systolic 04 137 183115 218 145 209 170 195 115 Question 1a: Data a. Use the proportion from question 1a. Test the claim that t...
 Serum Systolic Serum Systolic Serum Systolic Serum Systolic Serum Systolic 04 137 183115 218 145 209 170 195 115 Question 1a: Data a. Use the proportion from question 1a. Test the claim that the Sample 153 127 193 146 173 194 163 201...-174--157 proportion of Asianssi-s than 25%, use 219 ; 1191 163 160 174,160 140 Proportion 0.2 Critical Value 1.645 Margin of Error 0.0658 144 140 145 177 152166175 200 131 Hypotheses: You may write HO and Hl Test...
Show all work Question 6 3 pts Using Case Study D, which of the following is...
 Show all work
Question 6 3 pts Using Case Study D, which of the following is the best way to organize the data for the NPZ-8 scores with a class width of 3? 04:59: 10-14 0-2; 3-5; 6-8; 9-11; 12-14 20Frequency%20Distributions%20&%20Histograms%20 Tables.pdf TABLE 2.10 Nurse Sick Nurse Sick Nurse Sick Number Days Number Days Number Days 15 16 17 18 19 7 20 21 14 TABLE 2.11 App. 16 18 App. m 220 225 f135 137 f 180 201 m...
Show all work
Question 6 3 pts Using Case Study D, which of the following is the best way to organize the data for the NPZ-8 scores with a class width of 3? 04:59: 10-14 0-2; 3-5; 6-8; 9-11; 12-14 20Frequency%20Distributions%20&%20Histograms%20 Tables.pdf TABLE 2.10 Nurse Sick Nurse Sick Nurse Sick Number Days Number Days Number Days 15 16 17 18 19 7 20 21 14 TABLE 2.11 App. 16 18 App. m 220 225 f135 137 f 180 201 m...
%201%20-%20Frequency%20Distributions%20&%20H.stograms%20Tables.pdf TABLE 2.10 Nurse Sick Nurse Sick Nurse Sick Number Days Number Days Number Days 8...
 %201%20-%20Frequency%20Distributions%20&%20H.stograms%20Tables.pdf TABLE 2.10 Nurse Sick Nurse Sick Nurse Sick Number Days Number Days Number Days 8 17 18 3 19 7 20 12 14 TABLE 2.11 App App. Numb. Gender Ws Wp Numb. Gender Ws Wp 165 167 16 m 220 225 f 135 137 f 180 201 m 210 205 f 145 144 f131 133 m 177 180 m 135 135 m 183 180 m 165 166 m 215 210 17 m 190 186 f 115 111 19 m...
 The weights (in pounds) of 30 participants are recorded before
and after a 6 week exercise program.
A. Calculate the difference between the before weight and after
weight of all 30 participants, where a negative value represents
losing weight. Then, find the mean difference of weights. (Round
your answer to the nearest hundredth)
B. Next, find the sample standard deviation for the difference
of weights. (Round your answer to the nearest hundredth)
C. The goal is to find the 90%...
The weights (in pounds) of 30 participants are recorded before
and after a 6 week exercise program.
A. Calculate the difference between the before weight and after
weight of all 30 participants, where a negative value represents
losing weight. Then, find the mean difference of weights. (Round
your answer to the nearest hundredth)
B. Next, find the sample standard deviation for the difference
of weights. (Round your answer to the nearest hundredth)
C. The goal is to find the 90%...
 Bidder Distribution Hub 1 2 3 4 A 190 175 125 230 B 150 235 155 220 C 210 225 135 260 D 170 185 190 280 E 220 190 140 240 F 270 200 130 260 a. Develop the network of the problem. (1 Marks) b. Formulate the problem as a linear programming problem. (2 Marks) c. Solve assignment that minimizes total cost. (2 Marks)
 Serum Systolic Serum Systolic Serum Systolic Serum Systolic Serum Systolic 04 137 183115 218 145 209 170 195 115 Question 1a: Data a. Use the proportion from question 1a. Test the claim that the Sample 153 127 193 146 173 194 163 201...-174--157 proportion of Asianssi-s than 25%, use 219 ; 1191 163 160 174,160 140 Proportion 0.2 Critical Value 1.645 Margin of Error 0.0658 144 140 145 177 152166175 200 131 Hypotheses: You may write HO and Hl Test...
 Show all work
Question 6 3 pts Using Case Study D, which of the following is the best way to organize the data for the NPZ-8 scores with a class width of 3? 04:59: 10-14 0-2; 3-5; 6-8; 9-11; 12-14 20Frequency%20Distributions%20&%20Histograms%20 Tables.pdf TABLE 2.10 Nurse Sick Nurse Sick Nurse Sick Number Days Number Days Number Days 15 16 17 18 19 7 20 21 14 TABLE 2.11 App. 16 18 App. m 220 225 f135 137 f 180 201 m...
Show all work
Question 6 3 pts Using Case Study D, which of the following is the best way to organize the data for the NPZ-8 scores with a class width of 3? 04:59: 10-14 0-2; 3-5; 6-8; 9-11; 12-14 20Frequency%20Distributions%20&%20Histograms%20 Tables.pdf TABLE 2.10 Nurse Sick Nurse Sick Nurse Sick Number Days Number Days Number Days 15 16 17 18 19 7 20 21 14 TABLE 2.11 App. 16 18 App. m 220 225 f135 137 f 180 201 m...
 %201%20-%20Frequency%20Distributions%20&%20H.stograms%20Tables.pdf TABLE 2.10 Nurse Sick Nurse Sick Nurse Sick Number Days Number Days Number Days 8 17 18 3 19 7 20 12 14 TABLE 2.11 App App. Numb. Gender Ws Wp Numb. Gender Ws Wp 165 167 16 m 220 225 f 135 137 f 180 201 m 210 205 f 145 144 f131 133 m 177 180 m 135 135 m 183 180 m 165 166 m 215 210 17 m 190 186 f 115 111 19 m...
Most questions answered within 3 hours.
-
For the balanced reaction: CaCl2 (aq) + Na2CO3 (aq) -> CaCO3
(s) + 2 NaCl (aq),...
asked 12 seconds from now -
what is the current research being done on the hexokinase
enzyme?
asked 2 minutes ago -
An incline weighing 1,106 kg with its passengers travels uphill
800 meters on a 30 degree...
asked 2 minutes ago -
Let’s assume you want to retire with $1,000,000 in your
investment portfolio. Given that your investment...
asked 2 minutes ago -
profit motivation is one of the biggest differences between
public and private organizations. what about resource...
asked 1 minute ago -
Test the hypothesis using P-value approach. Be sure to verify
the requirements of the test.
H0:...
asked 4 minutes ago -
Balance the following oxidation-reduction equations using redox
methods:
Cu + H+ --------> Cu+ +
H2
asked 6 minutes ago -
Baltimore Manufacturing had a Work in Process balance of $84,000
on January 1, 2018. The year...
asked 9 minutes ago -
Need help converting into sql language.
How many players from each town served on the committee...
asked 21 minutes ago -
A professor needs to assign 15 teaching assistants to the course
STATISTICS 101. There are 40...
asked 23 minutes ago -
A palindrome is a word, phrase, number, or other sequence of
characters which reads the same...
asked 16 minutes ago -
1. Find a grammar for L(G) = {All bit strings with twice as many
1s as...
asked 21 minutes ago