

Homework Answers
Answer: Kindly check the reference column for easy understanding of formula this is extra benefit from our end.
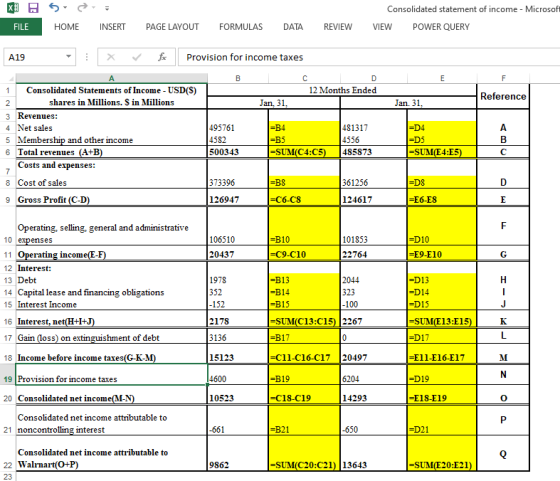
Answer: Horizontal Analysis

Add Answer to:
12 Months Ended Consolidated Statements of Income - USD ($) shares in Millions, $ in Millions...
12 Months Ended Consolidated Statements of Income - USD ($) shares in Millions, $ in Millions...
 12 Months Ended Consolidated Statements of Income - USD ($) shares in Millions, $ in Millions Jan. 31, Jan. 31, You Must Use Excel Formulas in Yellow Boxes 2018 2017 Revenues: Horizontal Horizontal Dollar Value Percent $495,761 $481,317 Net sales Membership and other income 4,582 4,556 Total revenues 500,343 485,873 Costs and expenses: Cost of sales Gross Profit Operating, selling, general and 373,396 361,256 126,947 124,617 106,510 101,853 administrative expenses 20,437 22,764 Operating income Interest: Debt Capital lease and financing...
12 Months Ended Consolidated Statements of Income - USD ($) shares in Millions, $ in Millions...
 12 Months Ended Consolidated Statements of Income - USD ($) shares in Millions, $ in Millions Jan. 31, 2018 Jan. 31, 2017 $495,761 4,582 500,343 0 0 $481,317 4 ,556 0 485,873 373,396 106,510 0 o 361,256 101,853 20,437 22,764 Revenues: Net sales Membership and other income Total revenues Costs and expenses: Cost of sales Operating, selling, general and administrative expenses 0 Operating income 1 Interest: 2 Debt 3 Capital lease and financing obligations 4 Interest income 5 Interest, net...
12 Months Ended Consolidated Statements of Income - USD ($) shares in Millions, $ in Millions...
 12 Months Ended Consolidated Statements of Income - USD ($) shares in Millions, $ in Millions Jan. 31, 2018 Jan. 31, 2017 99.08% 0 $ 495,761 4,582 500,343 $ 481,317 4,556 485,873 99.06% 0.94% 0 373,396 106,510 0 o 361,256 101,853 20,437 22,764 3 Revenues: 4 Net sales 5 Membership and other income 6 Total revenues 7 Costs and expenses: 8 Cost of sales Operating, selling, general and administrative 9 expenses 10 Operating income 11 Interest: 12 Debt 13 Capital...
2019 2018 2017 Dollar Change Dollar Ch $ $ S S Millions Assets Curent Assets: Cash...
 2019 2018 2017 Dollar Change Dollar Ch $ $ S S Millions Assets Curent Assets: Cash and cash equivalents Accounts receivable, net Inventories Prepaid expenses and other Total current assets Property and equipment: Property and equipment Less: Accumulated Depreciation Property and Equipment, net Property under Capital lease and fianancing obligations, net: Property under Capital lease and financing obligations Less: Accumulated amortization Property under capital lease and financing obligations, net. 7,722 6,283 44,269 3,623 61,897 6,756 5,614 43,783 3,511 59,664 6,867...
income statement Please solve debt management ratio and profitabilty ratio also explain what you did for...
 income statement
Please solve debt management ratio and profitabilty ratio also
explain what you did
for
2019
Walmart Inc. Consolidated Statements of Income Fiscal Years Eaded January 31, 2018 2017 2019 s 510,329 $ 4,076 514,405 495,761 S 4,582 500,343 481,317 4556 485,873 385,301 107,147 21,957 373,396 106,510 20,437 361 256 101 853 22,764 (Amount in millions, cept per share data) Revenues: Net sales Membership and other income Total revenues Costs and expenses: Cost of sales Operating, selling general and...
income statement
Please solve debt management ratio and profitabilty ratio also
explain what you did
for
2019
Walmart Inc. Consolidated Statements of Income Fiscal Years Eaded January 31, 2018 2017 2019 s 510,329 $ 4,076 514,405 495,761 S 4,582 500,343 481,317 4556 485,873 385,301 107,147 21,957 373,396 106,510 20,437 361 256 101 853 22,764 (Amount in millions, cept per share data) Revenues: Net sales Membership and other income Total revenues Costs and expenses: Cost of sales Operating, selling general and...
how can i get three years ratios . 2019 2018 2017 Dollar Change Dollar Ch $...
 how
can i get three years ratios .
2019 2018 2017 Dollar Change Dollar Ch $ $ S S Millions Assets Curent Assets: Cash and cash equivalents Accounts receivable, net Inventories Prepaid expenses and other Total current assets Property and equipment: Property and equipment Less: Accumulated Depreciation Property and Equipment, net Property under Capital lease and financing obligations, net: Property under Capital lease and financing obligations Less: Accumulated amortization Property under capital lease and financing obligations, net. 7,722 6,283 44,269...
how
can i get three years ratios .
2019 2018 2017 Dollar Change Dollar Ch $ $ S S Millions Assets Curent Assets: Cash and cash equivalents Accounts receivable, net Inventories Prepaid expenses and other Total current assets Property and equipment: Property and equipment Less: Accumulated Depreciation Property and Equipment, net Property under Capital lease and financing obligations, net: Property under Capital lease and financing obligations Less: Accumulated amortization Property under capital lease and financing obligations, net. 7,722 6,283 44,269...
calculate ROA ROE gross profit margin quick ratio debt to equity ratio inventory turnover calculate 2018...
 calculate
ROA
ROE
gross profit margin
quick ratio
debt to equity ratio
inventory turnover
calculate 2018 and 2019
1. ROA 2.DE 3. Groos profit 4. Quick ratio. 5. Debt to equity ratio: 6. Inventory turnover. nogin Eligibler Net Income = Total Revene- Total Expense. Total Assets = Liabilities + Owner's Equity Gross protit margin = (sales - rest of guels sodel/sales. 1. ROA 2. ROE 4. Quick ratio. 5. Debt to equity ratio. 6. Inventay turnover. 3. Gross protit Margin...
calculate
ROA
ROE
gross profit margin
quick ratio
debt to equity ratio
inventory turnover
calculate 2018 and 2019
1. ROA 2.DE 3. Groos profit 4. Quick ratio. 5. Debt to equity ratio: 6. Inventory turnover. nogin Eligibler Net Income = Total Revene- Total Expense. Total Assets = Liabilities + Owner's Equity Gross protit margin = (sales - rest of guels sodel/sales. 1. ROA 2. ROE 4. Quick ratio. 5. Debt to equity ratio. 6. Inventay turnover. 3. Gross protit Margin...
12 Months Ended Consolidated Statements of Operations - USD ($) shares in Millions, $ in Millions...
 12 Months Ended Consolidated Statements of Operations - USD ($) shares in Millions, $ in Millions Dec. 31, 2017 Dec. 31, 2016 Use Excel Formulas in Yellow Sheets $ 118,573 $ 94,665 59,293 41,322 177,866 135,987 Income Statement(Abstract) Net product sales 5 Net service sales 5 Total net sales 7 Operating expenses: B Cost of sales 9 Gross Profit 10 Fulfillment 11 Marketing 12 Technology and content 13 General and administrative 14 Other operating expense, net 15 Total operating expenses...
I need some help with this problem. please show work. many thanks Walmart Ine. Consolidated Statements...
 I need some help with this problem. please show work.
many thanks
Walmart Ine. Consolidated Statements of Income Fiscal Years Euded January 31, 2018 2019 2017 (Amounts in mtllions, axrapt per share data) Reveaues: 495,761 $10.329 481317 Net sales 4.076 4,582 4,556 Membership and ober incomse 435,873 514.405 500,343 Total ieveues Costs and expeases: 361 256 Cost of sales 373,396 385.301 101.853 Operating, selling, geseral and administrative esspenses 107,147 106,510 22.764 Operating income 20.437 21.957 Interest: Debe 1,978 2.044 1.975...
I need some help with this problem. please show work.
many thanks
Walmart Ine. Consolidated Statements of Income Fiscal Years Euded January 31, 2018 2019 2017 (Amounts in mtllions, axrapt per share data) Reveaues: 495,761 $10.329 481317 Net sales 4.076 4,582 4,556 Membership and ober incomse 435,873 514.405 500,343 Total ieveues Costs and expeases: 361 256 Cost of sales 373,396 385.301 101.853 Operating, selling, geseral and administrative esspenses 107,147 106,510 22.764 Operating income 20.437 21.957 Interest: Debe 1,978 2.044 1.975...
Pepsi Consolidated Statement of Cash Flows - USD ($) $ in Millions 12 Months Ended Dec....
Pepsi Consolidated Statement of Cash Flows - USD ($) $ in Millions 12 Months Ended Dec. 29, 2018 Dec. 30, 2017 Dec. 31, 2016 Operating Activities Net Income (Loss), Including Portion Attributable to Noncontrolling Interest $ 12,559 $ 4,908 $ 6,379 Depreciation and amortization 2,399 2,369 2,368 Share-based compensation expense 256 292 284 Restructuring and impairment charges 308 295 160 Cash payments for restructuring charges (255) (113) (125) Charge related to the transaction with Tingyi 0 0 373 Pension and...
 12 Months Ended Consolidated Statements of Income - USD ($) shares in Millions, $ in Millions Jan. 31, Jan. 31, You Must Use Excel Formulas in Yellow Boxes 2018 2017 Revenues: Horizontal Horizontal Dollar Value Percent $495,761 $481,317 Net sales Membership and other income 4,582 4,556 Total revenues 500,343 485,873 Costs and expenses: Cost of sales Gross Profit Operating, selling, general and 373,396 361,256 126,947 124,617 106,510 101,853 administrative expenses 20,437 22,764 Operating income Interest: Debt Capital lease and financing...
 12 Months Ended Consolidated Statements of Income - USD ($) shares in Millions, $ in Millions Jan. 31, 2018 Jan. 31, 2017 $495,761 4,582 500,343 0 0 $481,317 4 ,556 0 485,873 373,396 106,510 0 o 361,256 101,853 20,437 22,764 Revenues: Net sales Membership and other income Total revenues Costs and expenses: Cost of sales Operating, selling, general and administrative expenses 0 Operating income 1 Interest: 2 Debt 3 Capital lease and financing obligations 4 Interest income 5 Interest, net...
 12 Months Ended Consolidated Statements of Income - USD ($) shares in Millions, $ in Millions Jan. 31, 2018 Jan. 31, 2017 99.08% 0 $ 495,761 4,582 500,343 $ 481,317 4,556 485,873 99.06% 0.94% 0 373,396 106,510 0 o 361,256 101,853 20,437 22,764 3 Revenues: 4 Net sales 5 Membership and other income 6 Total revenues 7 Costs and expenses: 8 Cost of sales Operating, selling, general and administrative 9 expenses 10 Operating income 11 Interest: 12 Debt 13 Capital...
 2019 2018 2017 Dollar Change Dollar Ch $ $ S S Millions Assets Curent Assets: Cash and cash equivalents Accounts receivable, net Inventories Prepaid expenses and other Total current assets Property and equipment: Property and equipment Less: Accumulated Depreciation Property and Equipment, net Property under Capital lease and fianancing obligations, net: Property under Capital lease and financing obligations Less: Accumulated amortization Property under capital lease and financing obligations, net. 7,722 6,283 44,269 3,623 61,897 6,756 5,614 43,783 3,511 59,664 6,867...
 income statement
Please solve debt management ratio and profitabilty ratio also
explain what you did
for
2019
Walmart Inc. Consolidated Statements of Income Fiscal Years Eaded January 31, 2018 2017 2019 s 510,329 $ 4,076 514,405 495,761 S 4,582 500,343 481,317 4556 485,873 385,301 107,147 21,957 373,396 106,510 20,437 361 256 101 853 22,764 (Amount in millions, cept per share data) Revenues: Net sales Membership and other income Total revenues Costs and expenses: Cost of sales Operating, selling general and...
income statement
Please solve debt management ratio and profitabilty ratio also
explain what you did
for
2019
Walmart Inc. Consolidated Statements of Income Fiscal Years Eaded January 31, 2018 2017 2019 s 510,329 $ 4,076 514,405 495,761 S 4,582 500,343 481,317 4556 485,873 385,301 107,147 21,957 373,396 106,510 20,437 361 256 101 853 22,764 (Amount in millions, cept per share data) Revenues: Net sales Membership and other income Total revenues Costs and expenses: Cost of sales Operating, selling general and...
 how
can i get three years ratios .
2019 2018 2017 Dollar Change Dollar Ch $ $ S S Millions Assets Curent Assets: Cash and cash equivalents Accounts receivable, net Inventories Prepaid expenses and other Total current assets Property and equipment: Property and equipment Less: Accumulated Depreciation Property and Equipment, net Property under Capital lease and financing obligations, net: Property under Capital lease and financing obligations Less: Accumulated amortization Property under capital lease and financing obligations, net. 7,722 6,283 44,269...
how
can i get three years ratios .
2019 2018 2017 Dollar Change Dollar Ch $ $ S S Millions Assets Curent Assets: Cash and cash equivalents Accounts receivable, net Inventories Prepaid expenses and other Total current assets Property and equipment: Property and equipment Less: Accumulated Depreciation Property and Equipment, net Property under Capital lease and financing obligations, net: Property under Capital lease and financing obligations Less: Accumulated amortization Property under capital lease and financing obligations, net. 7,722 6,283 44,269...
 calculate
ROA
ROE
gross profit margin
quick ratio
debt to equity ratio
inventory turnover
calculate 2018 and 2019
1. ROA 2.DE 3. Groos profit 4. Quick ratio. 5. Debt to equity ratio: 6. Inventory turnover. nogin Eligibler Net Income = Total Revene- Total Expense. Total Assets = Liabilities + Owner's Equity Gross protit margin = (sales - rest of guels sodel/sales. 1. ROA 2. ROE 4. Quick ratio. 5. Debt to equity ratio. 6. Inventay turnover. 3. Gross protit Margin...
calculate
ROA
ROE
gross profit margin
quick ratio
debt to equity ratio
inventory turnover
calculate 2018 and 2019
1. ROA 2.DE 3. Groos profit 4. Quick ratio. 5. Debt to equity ratio: 6. Inventory turnover. nogin Eligibler Net Income = Total Revene- Total Expense. Total Assets = Liabilities + Owner's Equity Gross protit margin = (sales - rest of guels sodel/sales. 1. ROA 2. ROE 4. Quick ratio. 5. Debt to equity ratio. 6. Inventay turnover. 3. Gross protit Margin...
 12 Months Ended Consolidated Statements of Operations - USD ($) shares in Millions, $ in Millions Dec. 31, 2017 Dec. 31, 2016 Use Excel Formulas in Yellow Sheets $ 118,573 $ 94,665 59,293 41,322 177,866 135,987 Income Statement(Abstract) Net product sales 5 Net service sales 5 Total net sales 7 Operating expenses: B Cost of sales 9 Gross Profit 10 Fulfillment 11 Marketing 12 Technology and content 13 General and administrative 14 Other operating expense, net 15 Total operating expenses...
 I need some help with this problem. please show work.
many thanks
Walmart Ine. Consolidated Statements of Income Fiscal Years Euded January 31, 2018 2019 2017 (Amounts in mtllions, axrapt per share data) Reveaues: 495,761 $10.329 481317 Net sales 4.076 4,582 4,556 Membership and ober incomse 435,873 514.405 500,343 Total ieveues Costs and expeases: 361 256 Cost of sales 373,396 385.301 101.853 Operating, selling, geseral and administrative esspenses 107,147 106,510 22.764 Operating income 20.437 21.957 Interest: Debe 1,978 2.044 1.975...
I need some help with this problem. please show work.
many thanks
Walmart Ine. Consolidated Statements of Income Fiscal Years Euded January 31, 2018 2019 2017 (Amounts in mtllions, axrapt per share data) Reveaues: 495,761 $10.329 481317 Net sales 4.076 4,582 4,556 Membership and ober incomse 435,873 514.405 500,343 Total ieveues Costs and expeases: 361 256 Cost of sales 373,396 385.301 101.853 Operating, selling, geseral and administrative esspenses 107,147 106,510 22.764 Operating income 20.437 21.957 Interest: Debe 1,978 2.044 1.975...
Most questions answered within 3 hours.
-
A large cable company reports the following.
80% of its customers subscribe to its cable TV...
asked 1 minute from now -
Buying your in-laws a gift because it’s expected is
due to the ____________ motive of gift-giving....
asked 3 seconds ago -
Calculate the expected value, the variance, and the standard
deviation of the given random variable X....
asked 43 minutes ago -
A hospital performs 100 surgeries per week. The probability that
complications after surgery occur is 10%....
asked 59 minutes ago -
1 point) Given the significance level α=0.01 find the following:
(a) left-tailed z value z= (b)...
asked 41 minutes ago -
Assuming you are the head of the software development unit at
Cyber.Soft, explain and justify why...
asked 7 minutes ago -
Magnesium and nitrogen react in a combination reaction to
produce magnesium nitride. 3 Mg + N2...
asked 15 minutes ago -
Two electrons are initially at rest separated by a distance of
2nm. At time t=0, they...
asked 13 minutes ago -
A martial artist is practicing breaking 5 boards. He is able to
break aboard with probability...
asked 20 minutes ago -
The rate constant of a first-order reaction is 2.95 × 10⁻⁴ s−1
at 350.° C. If...
asked 23 minutes ago -
implement a class called PiggyBank that will be used to
represent a collection of coins. Functionality...
asked 14 minutes ago -
2. Use the following information in the table to answer the
following questions. (Numbers are in...
asked 20 minutes ago