


Homework Answers
please note that those formulas which uses average balance in calculation , ending balance have been considered as no information relating to 2017 was available.
| return on assets | net income / total assets | |
| 2019 ($ millions) | 2018 ($ millions) | |
| net income | 514405 | 500343 |
| total assets | 219295 | 204522 |
| return on assets | 2.35 | 2.45 |
| return on equity | net income / shareholders equity | |
| 2019 ($ millions) | 2018 ($ millions) | |
| net income | 514405 | 500343 |
| shareholders equity | 72496 | 77869 |
| return on equity | 7.10 | 6.43 |
| gross profit margin | (sales - cost of sales)/sales *100 | |
| 2019 ($ millions) | 2018 ($ millions) | |
| net sales | 510329 | 495761 |
| cost of sales | 385301 | 373396 |
| gross profit margin | 24.50% | 24.68% |
| quick ratio | quick assets / total current liabilities | |
| 2019 ($ millions) | 2018 ($ millions) | |
| cash | 7722 | 6756 |
| receivable | 6283 | 5614 |
| quick assets | 14005 | 12370 |
| total current liabilities | 77477 | 78521 |
| quick ratio | 0.18 | 0.16 |
| debt to equity ratio | total liabilities / shareholders equity | |
| 2019 ($ millions) | 2018 ($ millions) | |
| total liabilities | 139661 | 123700 |
| shareholders equity | 72496 | 77869 |
| debt to equity ratio | 1.93 | 1.59 |
| inventory turnover | cost of goods sold / ending inventory | |
| 2019 ($ millions) | 2018 ($ millions) | |
| cost of sales | 385301 | 373396 |
| ending inventory | 44269 | 43783 |
| inventory turnover | 8.70 | 8.53 |
Add Answer to:
calculate
ROA
ROE
gross profit margin
quick ratio
debt to equity ratio
inventory turnover
calculate 2018...
income statement Please solve debt management ratio and profitabilty ratio also explain what you did for...
 income statement
Please solve debt management ratio and profitabilty ratio also
explain what you did
for
2019
Walmart Inc. Consolidated Statements of Income Fiscal Years Eaded January 31, 2018 2017 2019 s 510,329 $ 4,076 514,405 495,761 S 4,582 500,343 481,317 4556 485,873 385,301 107,147 21,957 373,396 106,510 20,437 361 256 101 853 22,764 (Amount in millions, cept per share data) Revenues: Net sales Membership and other income Total revenues Costs and expenses: Cost of sales Operating, selling general and...
income statement
Please solve debt management ratio and profitabilty ratio also
explain what you did
for
2019
Walmart Inc. Consolidated Statements of Income Fiscal Years Eaded January 31, 2018 2017 2019 s 510,329 $ 4,076 514,405 495,761 S 4,582 500,343 481,317 4556 485,873 385,301 107,147 21,957 373,396 106,510 20,437 361 256 101 853 22,764 (Amount in millions, cept per share data) Revenues: Net sales Membership and other income Total revenues Costs and expenses: Cost of sales Operating, selling general and...
12 Months Ended Consolidated Statements of Income - USD ($) shares in Millions, $ in Millions...
 12 Months Ended Consolidated Statements of Income - USD ($) shares in Millions, $ in Millions Jan. 31, Jan. 31, You Must Use Excel Formulas in Yellow Boxes 2018 2017 Revenues: Horizontal Horizontal Dollar Value Percent $495,761 $481,317 Net sales Membership and other income 4,582 4,556 Total revenues 500,343 485,873 Costs and expenses: Cost of sales Gross Profit Operating, selling, general and 373,396 361,256 126,947 124,617 106,510 101,853 administrative expenses 20,437 22,764 Operating income Interest: Debt Capital lease and financing...
12 Months Ended Consolidated Statements of Income - USD ($) shares in Millions, $ in Millions...
 12 Months Ended Consolidated Statements of Income - USD ($) shares in Millions, $ in Millions Jan. 31, 2018 Jan. 31, 2017 $495,761 4,582 500,343 0 0 $481,317 4 ,556 0 485,873 373,396 106,510 0 o 361,256 101,853 20,437 22,764 Revenues: Net sales Membership and other income Total revenues Costs and expenses: Cost of sales Operating, selling, general and administrative expenses 0 Operating income 1 Interest: 2 Debt 3 Capital lease and financing obligations 4 Interest income 5 Interest, net...
12 Months Ended Consolidated Statements of Income - USD ($) shares in Millions, $ in Millions...
 12 Months Ended Consolidated Statements of Income - USD ($) shares in Millions, $ in Millions Jan. 31, 2018 Jan. 31, 2017 $ 495,761 4,582 500,343 0 $ 481,317 0 4,556 0 485,873 373,396 106,510 0 0 361,256 101,853 20,437 o 22,764 3Revenues: Net sales 5 Membership and other income 5 Total revenues Costs and expenses: Cost of sales Operating, selling, general and administrative expenses 10 Operating income 11 Interest: -2 Debt 3 Capital lease and financing obligations 4 Interest...
Current ratio Quick ratio Debt to equity ratio Times interest earned ratio Receivables turnover rati...
 Current ratio
Quick ratio
Debt to equity ratio
Times interest earned ratio
Receivables turnover ratio
Average collection period
Inventory turnover ratio
Average days inventory held
Payables turnover ratio
Average days payables outstanding
Asset turnover ratio
Profit margin on sales
Return on assets (ROA)
Return on shareholders' equity (ROE)
To calculate the above statement using the following
material:
FORD MOTOR COMPANY AND SUBSIDIARIES CONSOLIDATED BALANCE SHEET (in millions) December 31 2018 December 31 2017 ASSETS Cash and cash equivalents (Note 9)...
Current ratio
Quick ratio
Debt to equity ratio
Times interest earned ratio
Receivables turnover ratio
Average collection period
Inventory turnover ratio
Average days inventory held
Payables turnover ratio
Average days payables outstanding
Asset turnover ratio
Profit margin on sales
Return on assets (ROA)
Return on shareholders' equity (ROE)
To calculate the above statement using the following
material:
FORD MOTOR COMPANY AND SUBSIDIARIES CONSOLIDATED BALANCE SHEET (in millions) December 31 2018 December 31 2017 ASSETS Cash and cash equivalents (Note 9)...
12 Months Ended Consolidated Statements of Income - USD ($) shares in Millions, $ in Millions...
 12 Months Ended Consolidated Statements of Income - USD ($) shares in Millions, $ in Millions Jan. 31, 2018 Jan. 31, 2017 99.08% 0 $ 495,761 4,582 500,343 $ 481,317 4,556 485,873 99.06% 0.94% 0 373,396 106,510 0 o 361,256 101,853 20,437 22,764 3 Revenues: 4 Net sales 5 Membership and other income 6 Total revenues 7 Costs and expenses: 8 Cost of sales Operating, selling, general and administrative 9 expenses 10 Operating income 11 Interest: 12 Debt 13 Capital...
calculate the following financial indicators Current Ratio Debt/Equity Ratio Free Cash Flow Earnings...
 calculate the following financial
indicators
Current Ratio
Debt/Equity Ratio
Free Cash Flow
Earnings per Share
Price/Earnings Ratio
Return on Equity
Net Profit Margin
As Reported Annual Income Statement Report Date Currency Audit Status Consolidated Scale Net product sales Net services sales Total net sales Cost of sales Fulfillment expenses Marketing expenses Technology & content expenses General & administrative expenses Other operating expense (income), net Total operating expenses & costs Income from operations Interest income Interest expense...
calculate the following financial
indicators
Current Ratio
Debt/Equity Ratio
Free Cash Flow
Earnings per Share
Price/Earnings Ratio
Return on Equity
Net Profit Margin
As Reported Annual Income Statement Report Date Currency Audit Status Consolidated Scale Net product sales Net services sales Total net sales Cost of sales Fulfillment expenses Marketing expenses Technology & content expenses General & administrative expenses Other operating expense (income), net Total operating expenses & costs Income from operations Interest income Interest expense...
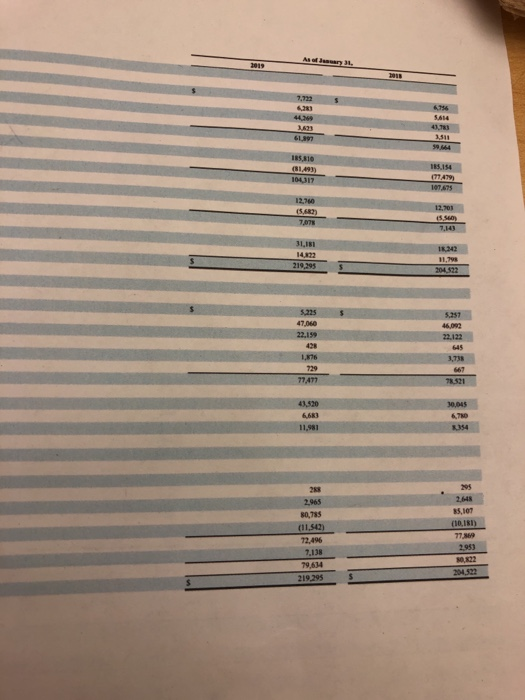
2019 2018 2017 Dollar Change Dollar Ch $ $ S S Millions Assets Curent Assets: Cash...
 2019 2018 2017 Dollar Change Dollar Ch $ $ S S Millions Assets Curent Assets: Cash and cash equivalents Accounts receivable, net Inventories Prepaid expenses and other Total current assets Property and equipment: Property and equipment Less: Accumulated Depreciation Property and Equipment, net Property under Capital lease and fianancing obligations, net: Property under Capital lease and financing obligations Less: Accumulated amortization Property under capital lease and financing obligations, net. 7,722 6,283 44,269 3,623 61,897 6,756 5,614 43,783 3,511 59,664 6,867...
AR inancial Statements: Wal-Mart Stores, Inc. ores, Inc.'s financial statements as presented in the company's 2016...
 AR inancial Statements: Wal-Mart Stores, Inc. ores, Inc.'s financial statements as presented in the company's 2016 annual report. The complete annual report, including notes to site. Consolidated Statements of Income Facal than inded onuary at 2016 2015 2014 Revenues Neties Membership and other income Total revenues Costs and expenses 547 614 3,516 82110 70 3.218 06.294 5651 Operating ng general and administrave expenses Operating income 10084 97,041 24,105 93418 27.147 97253 26,82 2027 2161 Capital lease and financing obligations 2,467...
(513) Repayments of long-term debt and other Principal repayments of capital lease obligations Principal repayments of...
 (513) Repayments of long-term debt and other Principal repayments of capital lease obligations Principal repayments of finance lease obligations Net cash provided by (used in) financing activities Foreign currency effect on cash and cash equivalents Net increase (decrease) in cash and cash equivalents CASH AND CASH EQUIVALENTS, END OF PERIOD SUPPLEMENTAL CASH FLOW INFORMATION: Cash paid for interest on long-term debt Cash paid for interest on capital and finance lease obligations Cash paid for income taxes, net of refunds Property...
 income statement
Please solve debt management ratio and profitabilty ratio also
explain what you did
for
2019
Walmart Inc. Consolidated Statements of Income Fiscal Years Eaded January 31, 2018 2017 2019 s 510,329 $ 4,076 514,405 495,761 S 4,582 500,343 481,317 4556 485,873 385,301 107,147 21,957 373,396 106,510 20,437 361 256 101 853 22,764 (Amount in millions, cept per share data) Revenues: Net sales Membership and other income Total revenues Costs and expenses: Cost of sales Operating, selling general and...
income statement
Please solve debt management ratio and profitabilty ratio also
explain what you did
for
2019
Walmart Inc. Consolidated Statements of Income Fiscal Years Eaded January 31, 2018 2017 2019 s 510,329 $ 4,076 514,405 495,761 S 4,582 500,343 481,317 4556 485,873 385,301 107,147 21,957 373,396 106,510 20,437 361 256 101 853 22,764 (Amount in millions, cept per share data) Revenues: Net sales Membership and other income Total revenues Costs and expenses: Cost of sales Operating, selling general and...
 12 Months Ended Consolidated Statements of Income - USD ($) shares in Millions, $ in Millions Jan. 31, Jan. 31, You Must Use Excel Formulas in Yellow Boxes 2018 2017 Revenues: Horizontal Horizontal Dollar Value Percent $495,761 $481,317 Net sales Membership and other income 4,582 4,556 Total revenues 500,343 485,873 Costs and expenses: Cost of sales Gross Profit Operating, selling, general and 373,396 361,256 126,947 124,617 106,510 101,853 administrative expenses 20,437 22,764 Operating income Interest: Debt Capital lease and financing...
 12 Months Ended Consolidated Statements of Income - USD ($) shares in Millions, $ in Millions Jan. 31, 2018 Jan. 31, 2017 $495,761 4,582 500,343 0 0 $481,317 4 ,556 0 485,873 373,396 106,510 0 o 361,256 101,853 20,437 22,764 Revenues: Net sales Membership and other income Total revenues Costs and expenses: Cost of sales Operating, selling, general and administrative expenses 0 Operating income 1 Interest: 2 Debt 3 Capital lease and financing obligations 4 Interest income 5 Interest, net...
 12 Months Ended Consolidated Statements of Income - USD ($) shares in Millions, $ in Millions Jan. 31, 2018 Jan. 31, 2017 $ 495,761 4,582 500,343 0 $ 481,317 0 4,556 0 485,873 373,396 106,510 0 0 361,256 101,853 20,437 o 22,764 3Revenues: Net sales 5 Membership and other income 5 Total revenues Costs and expenses: Cost of sales Operating, selling, general and administrative expenses 10 Operating income 11 Interest: -2 Debt 3 Capital lease and financing obligations 4 Interest...
 Current ratio
Quick ratio
Debt to equity ratio
Times interest earned ratio
Receivables turnover ratio
Average collection period
Inventory turnover ratio
Average days inventory held
Payables turnover ratio
Average days payables outstanding
Asset turnover ratio
Profit margin on sales
Return on assets (ROA)
Return on shareholders' equity (ROE)
To calculate the above statement using the following
material:
FORD MOTOR COMPANY AND SUBSIDIARIES CONSOLIDATED BALANCE SHEET (in millions) December 31 2018 December 31 2017 ASSETS Cash and cash equivalents (Note 9)...
Current ratio
Quick ratio
Debt to equity ratio
Times interest earned ratio
Receivables turnover ratio
Average collection period
Inventory turnover ratio
Average days inventory held
Payables turnover ratio
Average days payables outstanding
Asset turnover ratio
Profit margin on sales
Return on assets (ROA)
Return on shareholders' equity (ROE)
To calculate the above statement using the following
material:
FORD MOTOR COMPANY AND SUBSIDIARIES CONSOLIDATED BALANCE SHEET (in millions) December 31 2018 December 31 2017 ASSETS Cash and cash equivalents (Note 9)...
 12 Months Ended Consolidated Statements of Income - USD ($) shares in Millions, $ in Millions Jan. 31, 2018 Jan. 31, 2017 99.08% 0 $ 495,761 4,582 500,343 $ 481,317 4,556 485,873 99.06% 0.94% 0 373,396 106,510 0 o 361,256 101,853 20,437 22,764 3 Revenues: 4 Net sales 5 Membership and other income 6 Total revenues 7 Costs and expenses: 8 Cost of sales Operating, selling, general and administrative 9 expenses 10 Operating income 11 Interest: 12 Debt 13 Capital...
 calculate the following financial
indicators
Current Ratio
Debt/Equity Ratio
Free Cash Flow
Earnings per Share
Price/Earnings Ratio
Return on Equity
Net Profit Margin
As Reported Annual Income Statement Report Date Currency Audit Status Consolidated Scale Net product sales Net services sales Total net sales Cost of sales Fulfillment expenses Marketing expenses Technology & content expenses General & administrative expenses Other operating expense (income), net Total operating expenses & costs Income from operations Interest income Interest expense...
calculate the following financial
indicators
Current Ratio
Debt/Equity Ratio
Free Cash Flow
Earnings per Share
Price/Earnings Ratio
Return on Equity
Net Profit Margin
As Reported Annual Income Statement Report Date Currency Audit Status Consolidated Scale Net product sales Net services sales Total net sales Cost of sales Fulfillment expenses Marketing expenses Technology & content expenses General & administrative expenses Other operating expense (income), net Total operating expenses & costs Income from operations Interest income Interest expense...
 2019 2018 2017 Dollar Change Dollar Ch $ $ S S Millions Assets Curent Assets: Cash and cash equivalents Accounts receivable, net Inventories Prepaid expenses and other Total current assets Property and equipment: Property and equipment Less: Accumulated Depreciation Property and Equipment, net Property under Capital lease and fianancing obligations, net: Property under Capital lease and financing obligations Less: Accumulated amortization Property under capital lease and financing obligations, net. 7,722 6,283 44,269 3,623 61,897 6,756 5,614 43,783 3,511 59,664 6,867...
 AR inancial Statements: Wal-Mart Stores, Inc. ores, Inc.'s financial statements as presented in the company's 2016 annual report. The complete annual report, including notes to site. Consolidated Statements of Income Facal than inded onuary at 2016 2015 2014 Revenues Neties Membership and other income Total revenues Costs and expenses 547 614 3,516 82110 70 3.218 06.294 5651 Operating ng general and administrave expenses Operating income 10084 97,041 24,105 93418 27.147 97253 26,82 2027 2161 Capital lease and financing obligations 2,467...
 (513) Repayments of long-term debt and other Principal repayments of capital lease obligations Principal repayments of finance lease obligations Net cash provided by (used in) financing activities Foreign currency effect on cash and cash equivalents Net increase (decrease) in cash and cash equivalents CASH AND CASH EQUIVALENTS, END OF PERIOD SUPPLEMENTAL CASH FLOW INFORMATION: Cash paid for interest on long-term debt Cash paid for interest on capital and finance lease obligations Cash paid for income taxes, net of refunds Property...
Most questions answered within 3 hours.
-
1.How large must the coefficient of static friction be between
the tires and the road if...
asked 14 minutes ago -
What is the time complexity (Big-O) of the following code?
class Main
{
// Recursive...
asked 14 minutes ago -
Economists look at any situation in terms of its component
parts: the people making decisions, the...
asked 20 minutes ago -
What is a population?
Select one:
a. All of the individual organisms belonging to the same...
asked 24 minutes ago -
You have a yeast cell culture with a concentration of 5x10^4
cells/ml. If you dilute this...
asked 28 minutes ago -
In which direction the Reaction goes? Show detailed process.
SeO3 + 2ClO2. + 2H3O <---> Se...
asked 41 minutes ago -
Unexposed silver halides are removed from photographic film when
they react with sodium thiosulfate
(Na2S2O3, called...
asked 42 minutes ago -
A 0.3054 gram sample of the mineral chalcopyrite (CuFeS2)
yielded 0.6525 gram BaSO4 precipitate. What is...
asked 42 minutes ago -
An short-seller in Tesla is worried the latest management
earnings forecast is too aggressive and the...
asked 1 hour ago -
Question 3 (1 point)
Fill in the blank. Speed Car Rental company found that the tire...
asked 1 hour ago -
1. A copper wire is 26.61 cm long and weighs 1.265 g. The
density of copper...
asked 1 hour ago -
Remember that a concept sketch consists of a sketch (or
series of sketches), labels, and complete...
asked 1 hour ago