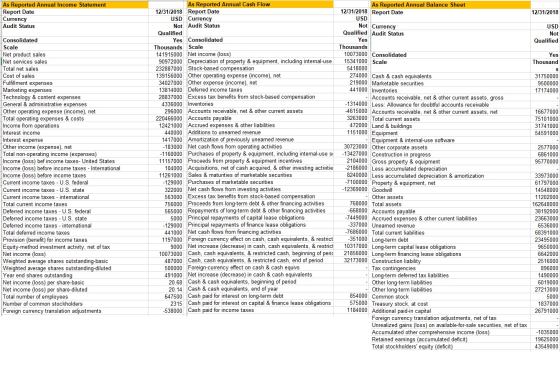
calculate the following financial indicators
Current Ratio
Debt/Equity Ratio
Free Cash Flow
Earnings per Share
Price/Earnings Ratio
Return on Equity
Net Profit Margin
Homework Answers
| answer | ||||||
| Current Ratio | CA/CL | 75101000/68391000 | 1.10 | |||
| Debt/Equity Ratio | 119099000/43549000 | 2.73 | ||||
| Free Cash Flow | Net cash from operations-capital expenditure | 30723000-2186000 | 28537000 | |||
| Earnings per Share | net income/weighted no. of outstanding common stock | 10073000/487000 | 20.64 | |||
| Price/Earnings Ratio | MPS/EPS | market price per share not given so we need to divided mps/eps | ||||
| Return on Equity | net income/total equityx100 | 10073000/43549000x100 | 23.13 | |||
| Net Profit Margin | net income/total salesx100 | 10073000/232887000x100 | 4.33 | |||
| working | ||||||
| Total debt | ||||||
| total current liabilities | 68391000 | |||||
| total long term debts | ||||||
| total assets-total current liabilties-stockholder equity | ||||||
| 162648000-68391000-43549000 | 50708000 | |||||
| Total debt | 119099000 | |||||
| if any doubt please comment | ||||||
Add Answer to:
calculate the following financial
indicators
Current Ratio
Debt/Equity Ratio
Free Cash Flow
Earnings...
Directions: Ratio Calculation On each data tab, use formulas to calculate the following financial indicators for...
Directions: Ratio Calculation On each data tab, use formulas to calculate the following financial indicators for each year of data: o Current ratio o Debt/equity ratio o Free cash flow o Earnings per share o Price/earnings ratio o Return on equity o Net profit margin o Describe how and why each of the ratios has changed over the three-year period. For example, did the current ratio increase or decrease? Why? Describe how three of the ratios you calculated for your...
What is the long-term debt to equity ratio for the year ending 10/31/2011? (Note the current...
What is the long-term debt to equity ratio for the year ending 10/31/2011? (Note the current portion of long-term debts is short-term debt.) 0.601 0.727 0.844 0.938 1.213 Toro Co. (The) (NYS: TTC) Exchange rate used is that of the Year End reported date As Reported Annual Balance Sheet Report Date 10/31/2011 Currency USD Audit Status Not Qualified Consolidated Yes Scale Thousands Cash & cash equivalents 80,886 Customer receivables, gross 144,364 Less: allowance for doubtful accounts 1,964 Customers receivables, net...
Based on the information contained in these financial statements, compute free cash flow for Amazon at...
 Based on the information contained in these financial
statements, compute free cash flow for Amazon at December 31, 2016
and Wal-Mart for January 31, 2017. What conclusions concerning the
management of cash can be drawn from free cash flow for each
company?
AMAZON.COM, INC. CONSOLIDATED STATEMENTS OF CASH FLOWS in millions) Year Ended December 31, 2014 2015 2016 $ 8,658 $ 14.557 $ 15,890 (241) 596 2,371 4.746 1,497 129 6,281 2,119 155 250 8,116 2,975 160 (20) (246) (829)...
Based on the information contained in these financial
statements, compute free cash flow for Amazon at December 31, 2016
and Wal-Mart for January 31, 2017. What conclusions concerning the
management of cash can be drawn from free cash flow for each
company?
AMAZON.COM, INC. CONSOLIDATED STATEMENTS OF CASH FLOWS in millions) Year Ended December 31, 2014 2015 2016 $ 8,658 $ 14.557 $ 15,890 (241) 596 2,371 4.746 1,497 129 6,281 2,119 155 250 8,116 2,975 160 (20) (246) (829)...
What is the financial leverage ratio for the year ending 10/31/2011? Toro Co. (The) (NYS: TTC)...
What is the financial leverage ratio for the year ending 10/31/2011? Toro Co. (The) (NYS: TTC) Exchange rate used is that of the Year End reported date As Reported Annual Balance Sheet Report Date 10/31/2011 Currency USD Audit Status Not Qualified Consolidated Yes Scale Thousands Cash & cash equivalents 80,886 Customer receivables, gross 144,364 Less: allowance for doubtful accounts 1,964 Customers receivables, net 142,400 Other receivables, net 5,740 Total receivables, net 148,140 Inventories, net 223,030 Prepaid expenses & other current...
What is the current ratio? (1:1) What is the debt ratio? (%) Show work please 1....
 What is the current ratio? (1:1)
What is the debt ratio? (%)
Show work please
1. What is the current ratio? (1:1) 2. What is the debt ratio? (%) *Income Statement Income StatementBalance SheetCash Flow Statement Annual Financials Annual Financials for Lowe's Cos. View Ratios Fiscal year is February January. All values USD millions 2019 Sales/Revenue 71.31B Cost of Goods Sold (COGS) incl. D&A 49.88B COGS excluding D&A 48.27B Depreciation & Amortization Expense 1.61B Depreciation 1.48B Amortization of Intangibles 130M...
What is the current ratio? (1:1)
What is the debt ratio? (%)
Show work please
1. What is the current ratio? (1:1) 2. What is the debt ratio? (%) *Income Statement Income StatementBalance SheetCash Flow Statement Annual Financials Annual Financials for Lowe's Cos. View Ratios Fiscal year is February January. All values USD millions 2019 Sales/Revenue 71.31B Cost of Goods Sold (COGS) incl. D&A 49.88B COGS excluding D&A 48.27B Depreciation & Amortization Expense 1.61B Depreciation 1.48B Amortization of Intangibles 130M...
1) calculate Free Cash Flows to Equity for 2018. Include cash in all measures of working...
 1) calculate Free Cash Flows to Equity for 2018. Include cash in
all measures of working capital for purposes of these
calculations:
Jimmy's Corp. Annual Income Statements For Years Ending December 31 Sales Cost of sales Gross profit 2017 $156,121,419 55.330.466 100,790,953 2018 $173,219,147 60.213.877 113,005,270 Net operating expenses Operating income 84.109.861 16,681,092 94.003.364 19,001,906 Other income (expense) Interest expense (1,629,942) (1,680,884) (981,955) (2,109,889) Pretax net income 13,370,266 15,910,062 Taxes (sub S) Net income (loss) $13,370,266 $15,910,062 2018 Jimmy's Corp....
1) calculate Free Cash Flows to Equity for 2018. Include cash in
all measures of working capital for purposes of these
calculations:
Jimmy's Corp. Annual Income Statements For Years Ending December 31 Sales Cost of sales Gross profit 2017 $156,121,419 55.330.466 100,790,953 2018 $173,219,147 60.213.877 113,005,270 Net operating expenses Operating income 84.109.861 16,681,092 94.003.364 19,001,906 Other income (expense) Interest expense (1,629,942) (1,680,884) (981,955) (2,109,889) Pretax net income 13,370,266 15,910,062 Taxes (sub S) Net income (loss) $13,370,266 $15,910,062 2018 Jimmy's Corp....
calculate ROA ROE gross profit margin quick ratio debt to equity ratio inventory turnover calculate 2018...
 calculate
ROA
ROE
gross profit margin
quick ratio
debt to equity ratio
inventory turnover
calculate 2018 and 2019
1. ROA 2.DE 3. Groos profit 4. Quick ratio. 5. Debt to equity ratio: 6. Inventory turnover. nogin Eligibler Net Income = Total Revene- Total Expense. Total Assets = Liabilities + Owner's Equity Gross protit margin = (sales - rest of guels sodel/sales. 1. ROA 2. ROE 4. Quick ratio. 5. Debt to equity ratio. 6. Inventay turnover. 3. Gross protit Margin...
calculate
ROA
ROE
gross profit margin
quick ratio
debt to equity ratio
inventory turnover
calculate 2018 and 2019
1. ROA 2.DE 3. Groos profit 4. Quick ratio. 5. Debt to equity ratio: 6. Inventory turnover. nogin Eligibler Net Income = Total Revene- Total Expense. Total Assets = Liabilities + Owner's Equity Gross protit margin = (sales - rest of guels sodel/sales. 1. ROA 2. ROE 4. Quick ratio. 5. Debt to equity ratio. 6. Inventay turnover. 3. Gross protit Margin...
Perform a financial analysis for Under Armor using the financial statements below. Using 3 years of...
 Perform a financial analysis for Under Armor using the financial
statements below. Using 3 years of data, compare the data to the
industry average in order to determine how the company is doing.
Please include the following ratios: Gross profit margin, ROI, ROE,
EPS, Inventory turnover, days of inventory, debt to asset ratio,
debt to equity ratio, times interest earned
THANK YOU!!!
December 31, 2009 December 31, 2006 December 31, 2007 $187.297 79356 148.888 19,989 12,870 448.000 72,926 5.681 13,908...
Perform a financial analysis for Under Armor using the financial
statements below. Using 3 years of data, compare the data to the
industry average in order to determine how the company is doing.
Please include the following ratios: Gross profit margin, ROI, ROE,
EPS, Inventory turnover, days of inventory, debt to asset ratio,
debt to equity ratio, times interest earned
THANK YOU!!!
December 31, 2009 December 31, 2006 December 31, 2007 $187.297 79356 148.888 19,989 12,870 448.000 72,926 5.681 13,908...
Using the income statement and balance sheets shown above, create an appropriate cash flow statement including...
 Using the income statement and balance sheets shown
above, create an appropriate cash flow statement including the
required disclosures. Thank you.
(Dollars in Millions) 2017 2016 $1,074 3,795 378 5,247 8,103 224 $13, 574 $707 4,038 331 5,076 8, 308 222 $13, 606 $1,507 1,200 24 112 $1,251 1,180 26 130 Assets Current assets: Cash and cash equivalents Merchandise inventories Prepaid expenses Total current assets Property and equipment, net Other assets Total assets Liabilities and Shareholders Equity Current liabilities: Accounts...
Using the income statement and balance sheets shown
above, create an appropriate cash flow statement including the
required disclosures. Thank you.
(Dollars in Millions) 2017 2016 $1,074 3,795 378 5,247 8,103 224 $13, 574 $707 4,038 331 5,076 8, 308 222 $13, 606 $1,507 1,200 24 112 $1,251 1,180 26 130 Assets Current assets: Cash and cash equivalents Merchandise inventories Prepaid expenses Total current assets Property and equipment, net Other assets Total assets Liabilities and Shareholders Equity Current liabilities: Accounts...
Using the income statement and balance sheets shown above, create an appropriate cash flow statement including...
 Using the income statement and balance sheets shown above, create an appropriate cash flow statement including the required disclosures. Thank you. (Dollars in Millions) 2017 2016 Assets Current assets: Cagh and cash equivalents Merchandise inventories Prepaid expenses Total current assets Property and equipment, net Other assets Total assets $1,074 3,795 378 5,247 8,103 224 $13, 574 $707 4,038 331 5,076 8, 308 222 $13, 606 $1,507 1,200 24 112 $1,251 1,180 26 130 134 127 All current portion paid Liabilities...
 Based on the information contained in these financial
statements, compute free cash flow for Amazon at December 31, 2016
and Wal-Mart for January 31, 2017. What conclusions concerning the
management of cash can be drawn from free cash flow for each
company?
AMAZON.COM, INC. CONSOLIDATED STATEMENTS OF CASH FLOWS in millions) Year Ended December 31, 2014 2015 2016 $ 8,658 $ 14.557 $ 15,890 (241) 596 2,371 4.746 1,497 129 6,281 2,119 155 250 8,116 2,975 160 (20) (246) (829)...
Based on the information contained in these financial
statements, compute free cash flow for Amazon at December 31, 2016
and Wal-Mart for January 31, 2017. What conclusions concerning the
management of cash can be drawn from free cash flow for each
company?
AMAZON.COM, INC. CONSOLIDATED STATEMENTS OF CASH FLOWS in millions) Year Ended December 31, 2014 2015 2016 $ 8,658 $ 14.557 $ 15,890 (241) 596 2,371 4.746 1,497 129 6,281 2,119 155 250 8,116 2,975 160 (20) (246) (829)...
 What is the current ratio? (1:1)
What is the debt ratio? (%)
Show work please
1. What is the current ratio? (1:1) 2. What is the debt ratio? (%) *Income Statement Income StatementBalance SheetCash Flow Statement Annual Financials Annual Financials for Lowe's Cos. View Ratios Fiscal year is February January. All values USD millions 2019 Sales/Revenue 71.31B Cost of Goods Sold (COGS) incl. D&A 49.88B COGS excluding D&A 48.27B Depreciation & Amortization Expense 1.61B Depreciation 1.48B Amortization of Intangibles 130M...
What is the current ratio? (1:1)
What is the debt ratio? (%)
Show work please
1. What is the current ratio? (1:1) 2. What is the debt ratio? (%) *Income Statement Income StatementBalance SheetCash Flow Statement Annual Financials Annual Financials for Lowe's Cos. View Ratios Fiscal year is February January. All values USD millions 2019 Sales/Revenue 71.31B Cost of Goods Sold (COGS) incl. D&A 49.88B COGS excluding D&A 48.27B Depreciation & Amortization Expense 1.61B Depreciation 1.48B Amortization of Intangibles 130M...
 1) calculate Free Cash Flows to Equity for 2018. Include cash in
all measures of working capital for purposes of these
calculations:
Jimmy's Corp. Annual Income Statements For Years Ending December 31 Sales Cost of sales Gross profit 2017 $156,121,419 55.330.466 100,790,953 2018 $173,219,147 60.213.877 113,005,270 Net operating expenses Operating income 84.109.861 16,681,092 94.003.364 19,001,906 Other income (expense) Interest expense (1,629,942) (1,680,884) (981,955) (2,109,889) Pretax net income 13,370,266 15,910,062 Taxes (sub S) Net income (loss) $13,370,266 $15,910,062 2018 Jimmy's Corp....
1) calculate Free Cash Flows to Equity for 2018. Include cash in
all measures of working capital for purposes of these
calculations:
Jimmy's Corp. Annual Income Statements For Years Ending December 31 Sales Cost of sales Gross profit 2017 $156,121,419 55.330.466 100,790,953 2018 $173,219,147 60.213.877 113,005,270 Net operating expenses Operating income 84.109.861 16,681,092 94.003.364 19,001,906 Other income (expense) Interest expense (1,629,942) (1,680,884) (981,955) (2,109,889) Pretax net income 13,370,266 15,910,062 Taxes (sub S) Net income (loss) $13,370,266 $15,910,062 2018 Jimmy's Corp....
 calculate
ROA
ROE
gross profit margin
quick ratio
debt to equity ratio
inventory turnover
calculate 2018 and 2019
1. ROA 2.DE 3. Groos profit 4. Quick ratio. 5. Debt to equity ratio: 6. Inventory turnover. nogin Eligibler Net Income = Total Revene- Total Expense. Total Assets = Liabilities + Owner's Equity Gross protit margin = (sales - rest of guels sodel/sales. 1. ROA 2. ROE 4. Quick ratio. 5. Debt to equity ratio. 6. Inventay turnover. 3. Gross protit Margin...
calculate
ROA
ROE
gross profit margin
quick ratio
debt to equity ratio
inventory turnover
calculate 2018 and 2019
1. ROA 2.DE 3. Groos profit 4. Quick ratio. 5. Debt to equity ratio: 6. Inventory turnover. nogin Eligibler Net Income = Total Revene- Total Expense. Total Assets = Liabilities + Owner's Equity Gross protit margin = (sales - rest of guels sodel/sales. 1. ROA 2. ROE 4. Quick ratio. 5. Debt to equity ratio. 6. Inventay turnover. 3. Gross protit Margin...
 Perform a financial analysis for Under Armor using the financial
statements below. Using 3 years of data, compare the data to the
industry average in order to determine how the company is doing.
Please include the following ratios: Gross profit margin, ROI, ROE,
EPS, Inventory turnover, days of inventory, debt to asset ratio,
debt to equity ratio, times interest earned
THANK YOU!!!
December 31, 2009 December 31, 2006 December 31, 2007 $187.297 79356 148.888 19,989 12,870 448.000 72,926 5.681 13,908...
Perform a financial analysis for Under Armor using the financial
statements below. Using 3 years of data, compare the data to the
industry average in order to determine how the company is doing.
Please include the following ratios: Gross profit margin, ROI, ROE,
EPS, Inventory turnover, days of inventory, debt to asset ratio,
debt to equity ratio, times interest earned
THANK YOU!!!
December 31, 2009 December 31, 2006 December 31, 2007 $187.297 79356 148.888 19,989 12,870 448.000 72,926 5.681 13,908...
 Using the income statement and balance sheets shown
above, create an appropriate cash flow statement including the
required disclosures. Thank you.
(Dollars in Millions) 2017 2016 $1,074 3,795 378 5,247 8,103 224 $13, 574 $707 4,038 331 5,076 8, 308 222 $13, 606 $1,507 1,200 24 112 $1,251 1,180 26 130 Assets Current assets: Cash and cash equivalents Merchandise inventories Prepaid expenses Total current assets Property and equipment, net Other assets Total assets Liabilities and Shareholders Equity Current liabilities: Accounts...
Using the income statement and balance sheets shown
above, create an appropriate cash flow statement including the
required disclosures. Thank you.
(Dollars in Millions) 2017 2016 $1,074 3,795 378 5,247 8,103 224 $13, 574 $707 4,038 331 5,076 8, 308 222 $13, 606 $1,507 1,200 24 112 $1,251 1,180 26 130 Assets Current assets: Cash and cash equivalents Merchandise inventories Prepaid expenses Total current assets Property and equipment, net Other assets Total assets Liabilities and Shareholders Equity Current liabilities: Accounts...
 Using the income statement and balance sheets shown above, create an appropriate cash flow statement including the required disclosures. Thank you. (Dollars in Millions) 2017 2016 Assets Current assets: Cagh and cash equivalents Merchandise inventories Prepaid expenses Total current assets Property and equipment, net Other assets Total assets $1,074 3,795 378 5,247 8,103 224 $13, 574 $707 4,038 331 5,076 8, 308 222 $13, 606 $1,507 1,200 24 112 $1,251 1,180 26 130 134 127 All current portion paid Liabilities...
Most questions answered within 3 hours.
-
1) In your own words, explain what elasticity of supply is
signifying. (Put in your own...
asked 56 seconds from now -
The risk of material misstatement due to fraud relating to
revenue recognition should be a. given...
asked 3 minutes ago -
what is spanish flu epidemiology with photos and reference for
photos
asked 6 minutes ago -
Light of wavelength 500 nm is used in a two slit interference
experiment, and a fringe...
asked 25 minutes ago -
A laser with a wavelength of 470. nm illuminates two narrow
slits. The interference pattern from...
asked 8 minutes ago -
1. What is the concentration of potassium hydroxide in the
reaction mixture formed by mixing 50.00...
asked 22 minutes ago -
CISC 1115 Assignment 6 Write a complete program, including
javadoc comments, to process voter statistics Input...
asked 15 minutes ago -
(25) A boat is traveling at 5.00 m/s in the same direction as
ocean waves of...
asked 18 minutes ago -
which of these answers is most reasonable estimate of the proton
concentration [h+] for an aqueous...
asked 24 minutes ago -
If the Henry’s law constant for oxygen in water is 1.3 x 10⁻³
M/atm at 25...
asked 25 minutes ago -
Your child is planning attend summer camp for three months,
starting 7 months from now. The...
asked 35 minutes ago -
asssume you are the employee representative on the executive
board at your company. You know the...
asked 39 minutes ago