Perform a financial analysis for Under Armor using the financial statements below. Using 3 years of data, compare the data to the industry average in order to determine how the company is doing. Please include the following ratios: Gross profit margin, ROI, ROE, EPS, Inventory turnover, days of inventory, debt to asset ratio, debt to equity ratio, times interest earned
THANK YOU!!!


Homework Answers
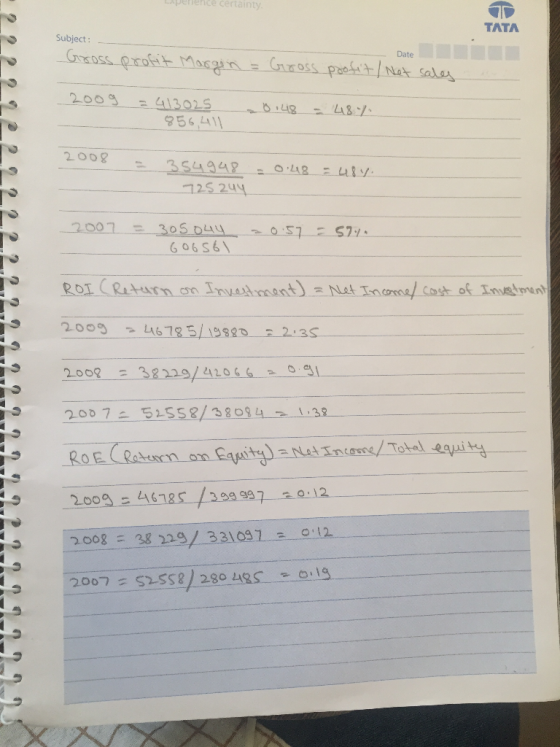

High Gross profit margin means good company"s condition.
Higher ROI is preferred.
Higher ROE ,the more efficient a company"s management is at generating income and growth from its equity financing.
Higher inventory turnover ratios are considered positive indicator of effective inventory.
Days of inventory shows how quickly a company can turn inventory into cash.
Lesser debt to assets ratio means company have more assets than liabilities.
Lower debt to equity ratio is preferred because their interest are better protected in the event of a business decline.
Add Answer to:
Perform a financial analysis for Under Armor using the financial
statements below. Using 3 years of...
calculate the following financial indicators Current Ratio Debt/Equity Ratio Free Cash Flow Earnings...
 calculate the following financial
indicators
Current Ratio
Debt/Equity Ratio
Free Cash Flow
Earnings per Share
Price/Earnings Ratio
Return on Equity
Net Profit Margin
As Reported Annual Income Statement Report Date Currency Audit Status Consolidated Scale Net product sales Net services sales Total net sales Cost of sales Fulfillment expenses Marketing expenses Technology & content expenses General & administrative expenses Other operating expense (income), net Total operating expenses & costs Income from operations Interest income Interest expense...
calculate the following financial
indicators
Current Ratio
Debt/Equity Ratio
Free Cash Flow
Earnings per Share
Price/Earnings Ratio
Return on Equity
Net Profit Margin
As Reported Annual Income Statement Report Date Currency Audit Status Consolidated Scale Net product sales Net services sales Total net sales Cost of sales Fulfillment expenses Marketing expenses Technology & content expenses General & administrative expenses Other operating expense (income), net Total operating expenses & costs Income from operations Interest income Interest expense...
Amazon Financial Statement Consolidated Statements Of Operations - USD ($) shares in Millions, $ in Millions...
Amazon Financial Statement Consolidated Statements Of Operations - USD ($) shares in Millions, $ in Millions 12 Months Ended Consolidated Balance Sheets - USD ($) $ in Millions Dec. 31, 2018 Dec. 31, 2017 Consolidated Statements of Cash Flows - USD ($) $ in Millions 12 Months Ended Dec. 31, 2018 Dec. 31, 2017 Dec. 31, 2016 Current assets: Dec. 31, 2018 Dec. 31, 2017 Dec. 31, 2016 Total net sales $ 232,887 $ 177,866 $ 135,987 Cash and cash...
Assume that Netflix made the following mistake in preparation of its 2015 statements, and no...

Assume that Netflix made the following mistake in preparation
of its 2015 statements, and no adjustments were
made:
No entry for accrued interest earned
of $4 on debt securities in “short-term investments” was made.
What would be the effect of the error
on the following amounts at year-end of 2015? Circle U/S
for understate, O/S for overstate, or NE for no
effect. Ignore income tax effects. (12 points)
Total
Liabilities US OS NE
Income Before Income
Taxes US OS NE
Total
Assets US OS NE
Stockholders’ Equity at
Year-End US OS NE
NETFLIX,...
Luther Corporation Consolidated Balance Sheet December 31, 2009 and 2008 (in 9 millions) 2009 2008 2009...
 Luther Corporation Consolidated Balance Sheet December 31, 2009 and 2008 (in 9 millions) 2009 2008 2009 2008 Assets Current Assets Cash 63.6 58.5 87.6 73.5 Accounts receivable 55.5 39.6 Liabilities and Stockholders' Equity Current Liabilities Accounts payable Notes payable/ short-term debt Current maturities of long-term debt Other current liabilities Total current liabilities 10.5 9.6 Inventories Other current assets 45.9 6.0 42.9 3.0 39.9 6.0 36.9 12.0 Total current assets 171.0 144.0 144.0 132.0 2 39.7 168.9 66.6 109.5 119.1 62.1...
Amazon.com, Inc.’s financial statements are presented in Appendix D. . Financial statements of Wal-Mart Stores, Inc....
 Amazon.com, Inc.’s financial statements are
presented in Appendix D.
.
Financial statements of Wal-Mart Stores, Inc. are
presented in Appendix E.
(b) What conclusions concerning the management of
cash can be drawn from free cash flow for each company?
AMAZON.COM, INC. CONSOLIDATED STATEMENTS OF CASH FLOWS (in millions) Year Ended December 31, 2014 2015 8,658 $ 14,557 $ 2016 15,890 (241) 596 2,371 4,746 1,497 129 6.281 2,119 155 250 81 (119) 59 8,116 2.975 160 (20) (246) (829) (316)...
Amazon.com, Inc.’s financial statements are
presented in Appendix D.
.
Financial statements of Wal-Mart Stores, Inc. are
presented in Appendix E.
(b) What conclusions concerning the management of
cash can be drawn from free cash flow for each company?
AMAZON.COM, INC. CONSOLIDATED STATEMENTS OF CASH FLOWS (in millions) Year Ended December 31, 2014 2015 8,658 $ 14,557 $ 2016 15,890 (241) 596 2,371 4,746 1,497 129 6.281 2,119 155 250 81 (119) 59 8,116 2.975 160 (20) (246) (829) (316)...
Develop a financial analysis of Phone Company Sprint for the years 2017, 2018, 2019 using 10K...
 Develop a financial analysis of Phone Company Sprint for
the years 2017, 2018, 2019 using 10K reported data.
Question: Is accounts payable growing faster
than revenue?
Question: Segment reposting - does the company
have reportable segments? if so, is Pareto alive and well?
3 Months Ended Jun 30, 2018 Mar. 31, 2018 12 Months Ended Mar. 31, 2018 Mar. 31, 2019 Dec 31, 2018 Sep 30, 2018 Dec 31, 2017 Sep. 30, 2017 Jun 30, 2017 Mar. 31, 2019 Mar...
Develop a financial analysis of Phone Company Sprint for
the years 2017, 2018, 2019 using 10K reported data.
Question: Is accounts payable growing faster
than revenue?
Question: Segment reposting - does the company
have reportable segments? if so, is Pareto alive and well?
3 Months Ended Jun 30, 2018 Mar. 31, 2018 12 Months Ended Mar. 31, 2018 Mar. 31, 2019 Dec 31, 2018 Sep 30, 2018 Dec 31, 2017 Sep. 30, 2017 Jun 30, 2017 Mar. 31, 2019 Mar...
Directions: Ratio Calculation On each data tab, use formulas to calculate the following financial indicators for...
Directions: Ratio Calculation On each data tab, use formulas to calculate the following financial indicators for each year of data: o Current ratio o Debt/equity ratio o Free cash flow o Earnings per share o Price/earnings ratio o Return on equity o Net profit margin o Describe how and why each of the ratios has changed over the three-year period. For example, did the current ratio increase or decrease? Why? Describe how three of the ratios you calculated for your...
Compute and Interpret the Z-score Balance sheets and income statements for Lockheed Martin Corporation follow. Refer...
 Compute and Interpret the Z-score Balance sheets and income statements for Lockheed Martin Corporation follow. Refer to these financial statements to answer the requirements. Consolidated Statements of Earnings Year Ended December 31 (In millions) 2016 2015 Net sales Products $ 40,365 $ 34,868 Services 6,883 5,668 Total net sales 47,248 40,536 Cost of sales Products (36,616) (31,091) Services (6,040) (4,824) Severance and other charges (80) (82) Other unallocated costs 550 (47) Total cost of sales (42,186) (36,044) Gross Profit 5,062...
Compute and Interpret the Z-score Balance sheets and income statements for Lockheed Martin Corporation follow. Refer...
Compute and Interpret the Z-score Balance sheets and income statements for Lockheed Martin Corporation follow. Refer to these financial statements to answer the requirements. Consolidated Statements of Earnings Year Ended December 31 (In millions) 2016 2015 Net sales Products $ 40,365 $ 34,868 Services 6,883 5,668 Total net sales 47,248 40,536 Cost of sales Products (36,616) (31,091) Services (6,040) (4,824) Severance and other charges (80) (82) Other unallocated costs 550 (47) Total cost of sales (42,186) (36,044) Gross Profit 5,062...
Looking for help on the questions below for the financial metrics required. If someone could please...
 Looking for help on the questions below for the
financial metrics required. If someone could please also explain
why my Liability to Equity ratio for 2016 is incorrect; while my
ratio for 2015 is correct and I used the same process to get both
numbers?
Thanks
550 Consolidated Statements of Earnings Year Ended December 31 (In millions) 2016 2015 Net sales Products $ 40,365 $ 34,868 Services 6,883 5,668 Total net sales 47,248 40,536 Cost of sales Products (36,616) (31,091)...
Looking for help on the questions below for the
financial metrics required. If someone could please also explain
why my Liability to Equity ratio for 2016 is incorrect; while my
ratio for 2015 is correct and I used the same process to get both
numbers?
Thanks
550 Consolidated Statements of Earnings Year Ended December 31 (In millions) 2016 2015 Net sales Products $ 40,365 $ 34,868 Services 6,883 5,668 Total net sales 47,248 40,536 Cost of sales Products (36,616) (31,091)...
 calculate the following financial
indicators
Current Ratio
Debt/Equity Ratio
Free Cash Flow
Earnings per Share
Price/Earnings Ratio
Return on Equity
Net Profit Margin
As Reported Annual Income Statement Report Date Currency Audit Status Consolidated Scale Net product sales Net services sales Total net sales Cost of sales Fulfillment expenses Marketing expenses Technology & content expenses General & administrative expenses Other operating expense (income), net Total operating expenses & costs Income from operations Interest income Interest expense...
calculate the following financial
indicators
Current Ratio
Debt/Equity Ratio
Free Cash Flow
Earnings per Share
Price/Earnings Ratio
Return on Equity
Net Profit Margin
As Reported Annual Income Statement Report Date Currency Audit Status Consolidated Scale Net product sales Net services sales Total net sales Cost of sales Fulfillment expenses Marketing expenses Technology & content expenses General & administrative expenses Other operating expense (income), net Total operating expenses & costs Income from operations Interest income Interest expense...

Assume that Netflix made the following mistake in preparation
of its 2015 statements, and no adjustments were
made:
No entry for accrued interest earned
of $4 on debt securities in “short-term investments” was made.
What would be the effect of the error
on the following amounts at year-end of 2015? Circle U/S
for understate, O/S for overstate, or NE for no
effect. Ignore income tax effects. (12 points)
Total
Liabilities US OS NE
Income Before Income
Taxes US OS NE
Total
Assets US OS NE
Stockholders’ Equity at
Year-End US OS NE
NETFLIX,...
 Luther Corporation Consolidated Balance Sheet December 31, 2009 and 2008 (in 9 millions) 2009 2008 2009 2008 Assets Current Assets Cash 63.6 58.5 87.6 73.5 Accounts receivable 55.5 39.6 Liabilities and Stockholders' Equity Current Liabilities Accounts payable Notes payable/ short-term debt Current maturities of long-term debt Other current liabilities Total current liabilities 10.5 9.6 Inventories Other current assets 45.9 6.0 42.9 3.0 39.9 6.0 36.9 12.0 Total current assets 171.0 144.0 144.0 132.0 2 39.7 168.9 66.6 109.5 119.1 62.1...
 Amazon.com, Inc.’s financial statements are
presented in Appendix D.
.
Financial statements of Wal-Mart Stores, Inc. are
presented in Appendix E.
(b) What conclusions concerning the management of
cash can be drawn from free cash flow for each company?
AMAZON.COM, INC. CONSOLIDATED STATEMENTS OF CASH FLOWS (in millions) Year Ended December 31, 2014 2015 8,658 $ 14,557 $ 2016 15,890 (241) 596 2,371 4,746 1,497 129 6.281 2,119 155 250 81 (119) 59 8,116 2.975 160 (20) (246) (829) (316)...
Amazon.com, Inc.’s financial statements are
presented in Appendix D.
.
Financial statements of Wal-Mart Stores, Inc. are
presented in Appendix E.
(b) What conclusions concerning the management of
cash can be drawn from free cash flow for each company?
AMAZON.COM, INC. CONSOLIDATED STATEMENTS OF CASH FLOWS (in millions) Year Ended December 31, 2014 2015 8,658 $ 14,557 $ 2016 15,890 (241) 596 2,371 4,746 1,497 129 6.281 2,119 155 250 81 (119) 59 8,116 2.975 160 (20) (246) (829) (316)...
 Develop a financial analysis of Phone Company Sprint for
the years 2017, 2018, 2019 using 10K reported data.
Question: Is accounts payable growing faster
than revenue?
Question: Segment reposting - does the company
have reportable segments? if so, is Pareto alive and well?
3 Months Ended Jun 30, 2018 Mar. 31, 2018 12 Months Ended Mar. 31, 2018 Mar. 31, 2019 Dec 31, 2018 Sep 30, 2018 Dec 31, 2017 Sep. 30, 2017 Jun 30, 2017 Mar. 31, 2019 Mar...
Develop a financial analysis of Phone Company Sprint for
the years 2017, 2018, 2019 using 10K reported data.
Question: Is accounts payable growing faster
than revenue?
Question: Segment reposting - does the company
have reportable segments? if so, is Pareto alive and well?
3 Months Ended Jun 30, 2018 Mar. 31, 2018 12 Months Ended Mar. 31, 2018 Mar. 31, 2019 Dec 31, 2018 Sep 30, 2018 Dec 31, 2017 Sep. 30, 2017 Jun 30, 2017 Mar. 31, 2019 Mar...
 Compute and Interpret the Z-score Balance sheets and income statements for Lockheed Martin Corporation follow. Refer to these financial statements to answer the requirements. Consolidated Statements of Earnings Year Ended December 31 (In millions) 2016 2015 Net sales Products $ 40,365 $ 34,868 Services 6,883 5,668 Total net sales 47,248 40,536 Cost of sales Products (36,616) (31,091) Services (6,040) (4,824) Severance and other charges (80) (82) Other unallocated costs 550 (47) Total cost of sales (42,186) (36,044) Gross Profit 5,062...
 Looking for help on the questions below for the
financial metrics required. If someone could please also explain
why my Liability to Equity ratio for 2016 is incorrect; while my
ratio for 2015 is correct and I used the same process to get both
numbers?
Thanks
550 Consolidated Statements of Earnings Year Ended December 31 (In millions) 2016 2015 Net sales Products $ 40,365 $ 34,868 Services 6,883 5,668 Total net sales 47,248 40,536 Cost of sales Products (36,616) (31,091)...
Looking for help on the questions below for the
financial metrics required. If someone could please also explain
why my Liability to Equity ratio for 2016 is incorrect; while my
ratio for 2015 is correct and I used the same process to get both
numbers?
Thanks
550 Consolidated Statements of Earnings Year Ended December 31 (In millions) 2016 2015 Net sales Products $ 40,365 $ 34,868 Services 6,883 5,668 Total net sales 47,248 40,536 Cost of sales Products (36,616) (31,091)...
Most questions answered within 3 hours.
-
Do not neglect the old for the new. The existing business must
not lose priority simply...
asked 2 hours ago -
Kylie is a single mom with two dependent children,
Tanner, age 7 and Olivia, age 11....
asked 3 hours ago -
Phosphorous + bromine = phosphorous tribromide. If 35.0 g of
bromine are reacted and 27.9 grams...
asked 4 hours ago -
Derive the long wavelength limit of the Planck energy density
distribution
asked 4 hours ago -
Calculate the pH of each of the following solutions.
0.50 M HBr
3.1×10⁻⁴ M KOH
4.2×10⁻⁵...
asked 8 hours ago -
For the year ended December 31, Depot Max’s cost of merchandise
sold was $85,600. Inventory at the...
asked 8 hours ago -
Week 10 - Professional Memo Assignment
Professional Memo Assignment
Your mission for this week, should you...
asked 8 hours ago -
Write a Python program that stores the data for each
player on the team, and it...
asked 8 hours ago -
In
the last 3 months, mike never knows when he is going to get his
allowance...
asked 9 hours ago -
Is Ca(OH)2 a Bronsted base, Lewis base, or both? Why?
asked 8 hours ago -
1A- Why don’t voters complain about U.S. tariffs on imported
sugar?
Because sugar is only a...
asked 9 hours ago -
Cash Payback Period
Primera Banco is evaluating two capital investment proposals for
a drive-up ATM kiosk,...
asked 9 hours ago