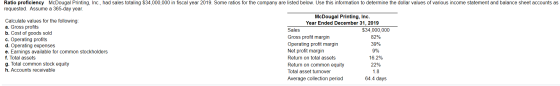
Ratio proficiency McDougal Printing, Inc., had sales totaling $34,000,000 in fiscal year 2019. Some ratios for the company are listed below. Use this information to determine the dollar values of various income statement and balance sheet accounts as requested. Assume a 365-day year.
Homework Answers
Answer to Part
a.
Gross Profit Margin = Gross Profit / Sales * 100
82 = Gross Profit / $34,000,000 / 100
Gross Profit = $27,880,000
Answer to Part
b.
Gross Profit = Sales - Cost of Goods Sold
$27,880,000 = $34,000,000 - Cost of Goods Sold
Cost of Goods Sold = $6,120,000
Answer to Part
c.
Operating Profit Margin = Operating Profit / Sales * 100
39 = Operating Profit / $34,000,000 * 100
Operating Profit = $13,260,000
Answer to Part
d.
Operating Profit = Gross Profit – Operating Expenses
$13,260,000 = $27,880,000 - Operating Expenses
Operating Expenses = $14,620,000
Answer to Part
e.
Net Profit Margin = Net Profit / Sales * 100
9 = Net Profit / $34,000,000 * 100
Net Profit = $3,060,000
Net Profit = Earnings available for Common Stockholders = $3,060,000
Answer to Part
f.
Total Assets Turnover = Sales / Total Assets
1.8 = $34,000,000 / Total Assets
Total Assets = $18,888,889
Answer to Part
g.
Return on Common Equity = Net Income / Total Common Stock Equity *
1000
22 = $3,060,000 / Total Common Stock Equity * 100
Total Common Stock Equity = $13,909,091
Answer to Part
h.
Average Collection period = 365 * Accounts Receivable / Sales
64.4 = 365 * Accounts Receivable / $34,000,000
Accounts Receivable = $5,998,904
Add Answer to:
Ratio proficiency McDougal Printing, Inc., had
sales totaling $34,000,000 in fiscal year 2019. Some ratios for...
Ratio proficiency McDougal Printing, Inc., had sales totaling $31,000,000 in fiscal year 2019. Some ratios for...
Ratio proficiency McDougal Printing, Inc., had sales totaling $31,000,000 in fiscal year 2019. Some ratios for the company are listed below. Use this information to determine the dollar values of various income statement and balance sheet accounts as requested. Assume a 365-day year. Calculate values for the following: a. Gross profits b. Cost of goods sold c. Operating profits d. Operating expenses e. Earnings available for common stockholders f. Total assets g. Total common stock equity h. Accounts receivable McDougal...
McDougal Printing. Inc., had sales totaling $34,000,000 in fiscal year 2019. Some ratios for the company...
 McDougal Printing. Inc., had sales totaling $34,000,000 in fiscal
year 2019. Some ratios for the company are listed (pictured) below.
Use this information to determine the dollar values of various
income statement and balance sheet accounts as requested. Assume a
365-day year.
Calculate values for the following (round to the nearest
dollar):
a. Gross profits
b. Cost of goods
c. Operating Profits
d. Operating expenses
e. Earnings available for common stockholders
f. Total assets
g. Total common stock equity
h....
McDougal Printing. Inc., had sales totaling $34,000,000 in fiscal
year 2019. Some ratios for the company are listed (pictured) below.
Use this information to determine the dollar values of various
income statement and balance sheet accounts as requested. Assume a
365-day year.
Calculate values for the following (round to the nearest
dollar):
a. Gross profits
b. Cost of goods
c. Operating Profits
d. Operating expenses
e. Earnings available for common stockholders
f. Total assets
g. Total common stock equity
h....
Ratio proficiency McDougal Printing, Inc., had sales totaling $43,000,000 in fiscal year 2015. Some ratios for...
 Ratio proficiency McDougal Printing, Inc., had sales totaling $43,000,000 in fiscal year 2015. Some ratios for the company are listed below. Use this information to determine the dollar values of various income statement and balance sheet accounts as requested. Assume a 365-day year McDougal Printing, Inc. Year Ended December 31, 2015 Calculate values for the following: a. Gross profits b. Cost of goods sold c. Operating profits d. Operating expenses e. Earnings available for common stockholders f. Total assets g....
Actual 2019 Dana Dairy Products Key Ratios Industry Actual Average 2018 Current ratio 1.3 1.0 Quick...
 Actual 2019 Dana Dairy Products Key Ratios Industry Actual Average 2018 Current ratio 1.3 1.0 Quick ratio 0.8 0.75 Average collection period 23 days 30 days Inventory turnover 21.7 Debt ratio 64.7% Times interest eamed 4.8 5.5 Gross profit margin 13.6% 12.0% Net profit margin 1.0% 0.5% Return on total assets 2.9% 20% Retum on equity 8.2% 4.0% 19 50% Income Statement Dana Dairy Products For the Year Ended December 31, 2019 Sales revenue $100,000 Less: Cost of goods sold...
1. Given the 2019 ratios of Verizon wireless what do EACH of these ratios indicate about...
1. Given the 2019 ratios of Verizon wireless what do EACH of these ratios indicate about the company specifically? (not just as a whole) 2. Lastly, at the end, in one paragraph what do these calculations (all together) mean for the companies financial health? Answers must be broken down into everyday language and not in "financial talk" Profit ratios: gross profit margin (gross profit / sales)*100 gross profit 77142000 sales 131868000 gross profit margin 58.50% operating profit margin (operating profit...
Compute the various financial ratios and interpret the firm's financial health during the fiscal-year 2009. Note...
 Compute the various financial ratios and interpret the firm's
financial health during the fiscal-year 2009. Note that the balance
sheet and the income statement entries in this problem are not
complete. Only relevant entries are listed. Do not attempt to add
individual entries to confirm either current assets or current
liabilities. Please show details.
2.4 The balance sheet in Table P2.4 summarizes the financial conditions for Flex Inc., an electronic outsourcing contractor, for fiscal-year 2009. Unlike Nano Networks in Problem...
Compute the various financial ratios and interpret the firm's
financial health during the fiscal-year 2009. Note that the balance
sheet and the income statement entries in this problem are not
complete. Only relevant entries are listed. Do not attempt to add
individual entries to confirm either current assets or current
liabilities. Please show details.
2.4 The balance sheet in Table P2.4 summarizes the financial conditions for Flex Inc., an electronic outsourcing contractor, for fiscal-year 2009. Unlike Nano Networks in Problem...
(Financial Ratios-Investment Analysis) The annual sales for Salco, Inc., were $5,000,000 last year. The firm's end-of-year...
 (Financial Ratios-Investment Analysis) The annual sales for Salco, Inc., were $5,000,000 last year. The firm's end-of-year balance sheet appeared as follows: Current assets $500,000 Net fixed assets $1,500,000 $2,000,000 Liabilities $1,000,000 common' equity $1,000,000 $2,000,000 The firm's income statement for the year was as follows: Sales Less: Cost of goods sold Gross profit Less: Operating expenses Operating income Less: Interest expense Earnings before taxes Less: Taxes (40%) Net income $5.000.000 (3,000,000) $2,000,000 (1,500,000) $500,000 (100,000 $400,000 (160.000) $240.000 a. Calculate...
Metlock Inc. reported the following information at the end of its 2019 fiscal year. Metlock Inc....
Metlock Inc. reported the following information at the end of its 2019 fiscal year. Metlock Inc. Statement of Financial Position As at April 30 Assets 2020 2019 Cash 209,000 155,000 Accounts receivable 112,000 94,000 Inventory 108,000 250,000 Prepaid operating expenses 19,000 13,000 Long term investments 182,000 84,000 Equipment 1,237,000 1,170,000 Less: Accumulated depreciation (367,000 ) (369,000 ) 1,500,000 1,397,000 Liabilities and Shareholders' Equity Accounts payable 52,000 65,000 Income tax payable 27,000 24,000 Bonds payable 673,000 765,000 Common shares 300,000 245,000...
Prepare ratio analyses (for the three year time period). You will compute the following ratios: Profitability...
 Prepare ratio analyses (for the three
year time period). You will compute the following ratios:
Profitability ratios:
Gross Profit margin
Operating expense margin
Profit margin
Return on assets
Return on equity
Productivity ratios:
Accounts Receivable Turnover
Days Sales Outstanding
Inventory Turnover
Days inventory outstanding
Accounts Payable turnover
Days payable outstanding
Cash Conversion Cycle
PPE Turnover
Coverage ratios:
Total liabilities-to-equity
Total debt to equity
Cash from operations to total debt
Times interest earned
Liquidity ratios:
Current Ratio
Quick Ratio
We were...
Prepare ratio analyses (for the three
year time period). You will compute the following ratios:
Profitability ratios:
Gross Profit margin
Operating expense margin
Profit margin
Return on assets
Return on equity
Productivity ratios:
Accounts Receivable Turnover
Days Sales Outstanding
Inventory Turnover
Days inventory outstanding
Accounts Payable turnover
Days payable outstanding
Cash Conversion Cycle
PPE Turnover
Coverage ratios:
Total liabilities-to-equity
Total debt to equity
Cash from operations to total debt
Times interest earned
Liquidity ratios:
Current Ratio
Quick Ratio
We were...
Problem 5-87A (Algorithmic) Ratio Analysis Selected information from Bigg Company's financial statements follows: Gross sales Less:...
 Problem 5-87A (Algorithmic) Ratio Analysis Selected information from Bigg Company's financial statements follows: Gross sales Less: Sales discounts Less: Sales returns and allowances Net sales Cost of goods sold Gross profit Operating expenses Operating income Other income (expenses) Net income Fiscal Year Ended December 31 2019 2018 2017 (in thousands) $2,004,719 $1,937,021 $1,835,987 4,811 4,649 4,406 2,406 2,324 2,203 $1,997,502 $1,930,048 $1,829,378 621,463 619,847 660,955 $1,376,039 $1,310,201 $1,168,423 577,369 595,226 583,555 $798,670 $714,975 $584,868 15,973 (5,910) (8,773) $814,643 $709,065 $576,095...
 McDougal Printing. Inc., had sales totaling $34,000,000 in fiscal
year 2019. Some ratios for the company are listed (pictured) below.
Use this information to determine the dollar values of various
income statement and balance sheet accounts as requested. Assume a
365-day year.
Calculate values for the following (round to the nearest
dollar):
a. Gross profits
b. Cost of goods
c. Operating Profits
d. Operating expenses
e. Earnings available for common stockholders
f. Total assets
g. Total common stock equity
h....
McDougal Printing. Inc., had sales totaling $34,000,000 in fiscal
year 2019. Some ratios for the company are listed (pictured) below.
Use this information to determine the dollar values of various
income statement and balance sheet accounts as requested. Assume a
365-day year.
Calculate values for the following (round to the nearest
dollar):
a. Gross profits
b. Cost of goods
c. Operating Profits
d. Operating expenses
e. Earnings available for common stockholders
f. Total assets
g. Total common stock equity
h....
 Ratio proficiency McDougal Printing, Inc., had sales totaling $43,000,000 in fiscal year 2015. Some ratios for the company are listed below. Use this information to determine the dollar values of various income statement and balance sheet accounts as requested. Assume a 365-day year McDougal Printing, Inc. Year Ended December 31, 2015 Calculate values for the following: a. Gross profits b. Cost of goods sold c. Operating profits d. Operating expenses e. Earnings available for common stockholders f. Total assets g....
 Actual 2019 Dana Dairy Products Key Ratios Industry Actual Average 2018 Current ratio 1.3 1.0 Quick ratio 0.8 0.75 Average collection period 23 days 30 days Inventory turnover 21.7 Debt ratio 64.7% Times interest eamed 4.8 5.5 Gross profit margin 13.6% 12.0% Net profit margin 1.0% 0.5% Return on total assets 2.9% 20% Retum on equity 8.2% 4.0% 19 50% Income Statement Dana Dairy Products For the Year Ended December 31, 2019 Sales revenue $100,000 Less: Cost of goods sold...
 Compute the various financial ratios and interpret the firm's
financial health during the fiscal-year 2009. Note that the balance
sheet and the income statement entries in this problem are not
complete. Only relevant entries are listed. Do not attempt to add
individual entries to confirm either current assets or current
liabilities. Please show details.
2.4 The balance sheet in Table P2.4 summarizes the financial conditions for Flex Inc., an electronic outsourcing contractor, for fiscal-year 2009. Unlike Nano Networks in Problem...
Compute the various financial ratios and interpret the firm's
financial health during the fiscal-year 2009. Note that the balance
sheet and the income statement entries in this problem are not
complete. Only relevant entries are listed. Do not attempt to add
individual entries to confirm either current assets or current
liabilities. Please show details.
2.4 The balance sheet in Table P2.4 summarizes the financial conditions for Flex Inc., an electronic outsourcing contractor, for fiscal-year 2009. Unlike Nano Networks in Problem...
 (Financial Ratios-Investment Analysis) The annual sales for Salco, Inc., were $5,000,000 last year. The firm's end-of-year balance sheet appeared as follows: Current assets $500,000 Net fixed assets $1,500,000 $2,000,000 Liabilities $1,000,000 common' equity $1,000,000 $2,000,000 The firm's income statement for the year was as follows: Sales Less: Cost of goods sold Gross profit Less: Operating expenses Operating income Less: Interest expense Earnings before taxes Less: Taxes (40%) Net income $5.000.000 (3,000,000) $2,000,000 (1,500,000) $500,000 (100,000 $400,000 (160.000) $240.000 a. Calculate...
 Prepare ratio analyses (for the three
year time period). You will compute the following ratios:
Profitability ratios:
Gross Profit margin
Operating expense margin
Profit margin
Return on assets
Return on equity
Productivity ratios:
Accounts Receivable Turnover
Days Sales Outstanding
Inventory Turnover
Days inventory outstanding
Accounts Payable turnover
Days payable outstanding
Cash Conversion Cycle
PPE Turnover
Coverage ratios:
Total liabilities-to-equity
Total debt to equity
Cash from operations to total debt
Times interest earned
Liquidity ratios:
Current Ratio
Quick Ratio
We were...
Prepare ratio analyses (for the three
year time period). You will compute the following ratios:
Profitability ratios:
Gross Profit margin
Operating expense margin
Profit margin
Return on assets
Return on equity
Productivity ratios:
Accounts Receivable Turnover
Days Sales Outstanding
Inventory Turnover
Days inventory outstanding
Accounts Payable turnover
Days payable outstanding
Cash Conversion Cycle
PPE Turnover
Coverage ratios:
Total liabilities-to-equity
Total debt to equity
Cash from operations to total debt
Times interest earned
Liquidity ratios:
Current Ratio
Quick Ratio
We were...
 Problem 5-87A (Algorithmic) Ratio Analysis Selected information from Bigg Company's financial statements follows: Gross sales Less: Sales discounts Less: Sales returns and allowances Net sales Cost of goods sold Gross profit Operating expenses Operating income Other income (expenses) Net income Fiscal Year Ended December 31 2019 2018 2017 (in thousands) $2,004,719 $1,937,021 $1,835,987 4,811 4,649 4,406 2,406 2,324 2,203 $1,997,502 $1,930,048 $1,829,378 621,463 619,847 660,955 $1,376,039 $1,310,201 $1,168,423 577,369 595,226 583,555 $798,670 $714,975 $584,868 15,973 (5,910) (8,773) $814,643 $709,065 $576,095...
Most questions answered within 3 hours.
-
Given the following JavaScript code, what will be displayed on
the web page?
var x =...
asked 4 minutes ago -
The cynics, skeptics, epicureans, & stoics were most
philosophies that dealt with:
a. the physical...
asked 6 minutes ago -
The hydronium ion concentration of an aqueous solution of 0.333
M trimethylamine (a weak base with...
asked 7 minutes ago -
A buffer is prepared by partially titrating 50.00 mL of 0.964 M
benzoic acid using 0,100...
asked 10 minutes ago -
For a Generalized Additive Model, what does a large
edf(empirical distribution function) value mean?
Thank you...
asked 23 minutes ago -
questions for Biology lab
An agarose gel electrophoresis assay performed with high quality
will NOT have...
asked 28 minutes ago -
A spring with spring constant 400 N/m is anchored at the bottom
of a frictionless 30^∘...
asked 31 minutes ago -
The half-life of 238U is 4.5×10⁹ yr.
Find the number of disintegrations per hour emitted by...
asked 40 minutes ago -
y[n] = x[n] - 3x[n - 1] + 4x[n - 2]
What is the transfer function...
asked 46 minutes ago -
Which one of the following statements is TRUE?
a.
An agency relationship is when someone hires...
asked 1 hour ago -
Consider the liquid phase reaction : A ---> Products which is
to take place in a...
asked 1 hour ago -
QUESTION ONE: For the following reaction, 13.4 grams of chlorine
gas are allowed to react with...
asked 1 hour ago