
Homework Answers
Add Answer to:
Suppose a random sample of 150 universities is used to test the null hypothesis that the...
Suppose a random sample of 150 universities is used to test the null hypothesis that the...
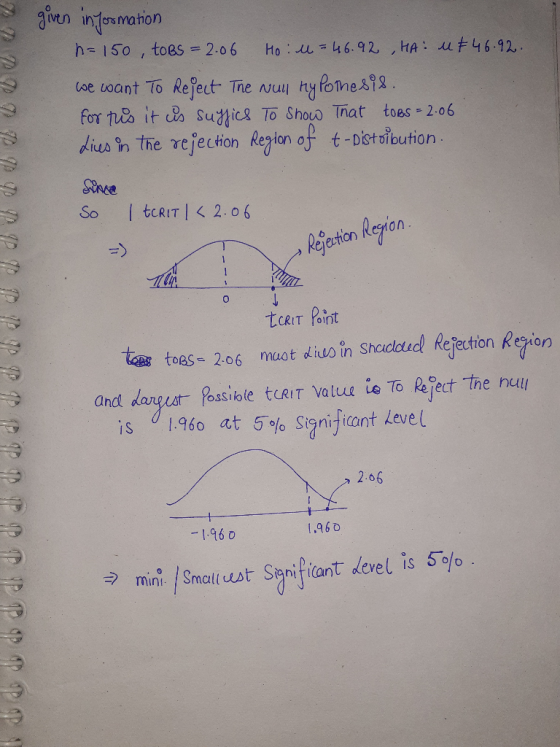
 Suppose a random sample of 150 universities is used to test the null hypothesis that the average number of spam emails economics graduate students receive in a month is 46.92. The value of the test statistic is found to be 2.54 if the nullis tested against the alternative hypothesis that the number of spam emails is not 46.92, the smallest significance level at which you can reject the null hypothesis is (Round your answer to four decimal places.)
9 Test the null hypothesis Ho : u = 3.0against the alternative hypothesis HA: U < 3.0 , based on a random sample of 2...
 9
Test the null hypothesis Ho : u = 3.0against the alternative hypothesis HA: U < 3.0 , based on a random sample of 25 observations drawn from a normally distributed population with ū = 2.8 and o = 0.70. a) What is the value of the test statistic? Round your response to at least 3 decimal places. Number b) What is the appropriate p-value? Round your response to at least 3 decimal places. Number c) Is the null hypothesis...
9
Test the null hypothesis Ho : u = 3.0against the alternative hypothesis HA: U < 3.0 , based on a random sample of 25 observations drawn from a normally distributed population with ū = 2.8 and o = 0.70. a) What is the value of the test statistic? Round your response to at least 3 decimal places. Number b) What is the appropriate p-value? Round your response to at least 3 decimal places. Number c) Is the null hypothesis...
Suppose we want to test the null hypothesis H0 : p = 0.34 against the alternative...
Suppose we want to test the null hypothesis H0 : p = 0.34 against the alternative hypothesis H1 : p > 0.34. Suppose also that we observed 120 successes in a random sample of 300 subjects and the level of significance is 0.05. What is the observed test statistic for this test? a. -2.194 b. 2.194 c. 0.05 d. 0.4
Test the null hypothesis H0:μ=3.2against the alternative hypothesis HA:μ<3.2, based on a random sample of 25...
Test the null hypothesis H0:μ=3.2against the alternative hypothesis HA:μ<3.2, based on a random sample of 25 observations drawn from a normally distributed population with x¯=3 and σ=0.72. a) What is the value of the test statistic? Round your response to at least 3 decimal places. b) What is the appropriate p-value? Round your response to at least 3 decimal places. c) Is the null hypothesis rejected at: i) the 10% level of significance? ii) the 5% level of significance?
Identify the null hypothesis. alternative hypothesis, test statistic, decision about the null hypothesis and final conclusion...
 Identify the null hypothesis. alternative hypothesis, test statistic, decision about the null hypothesis and final conclusion that addresses the original claim Various temperature measurements are recorded at different times for a particular city. The mean of 20 degrees is obtained for 60 temperatures on 60 different days. Assuming that the population standard deviation is 1.5 degrees, test the claim that the population mean is 22 degrees. Use a 0.05 significance level Hou = 22; H1 is u# 22 Test statistic:...
Test the null hypothesis H0:μ=3.2against the alternative hypothesis HA:μ<3.2, based on a random sample of 25...
Test the null hypothesis H0:μ=3.2against the alternative hypothesis HA:μ<3.2, based on a random sample of 25 observations drawn from a normally distributed population with x¯=3 and σ=0.71. a) What is the value of the test statistic? Round your response to at least 3 decimal places. b) What is the appropriate p-value? Round your response to at least 3 decimal places. c) Is the null hypothesis rejected at: i) the 10% level of significance? NoYesClick for List ii) the...
Test the null hypothesis H0:μ=3.3against the alternative hypothesis HA:μ<3.3, based on a random sample of 25...
Test the null hypothesis H0:μ=3.3against the alternative hypothesis HA:μ<3.3, based on a random sample of 25 observations drawn from a normally distributed population with x¯=3.1 and σ=0.68. a) What is the value of the test statistic? Round your response to at least 3 decimal places. b) What is the appropriate p-value? Round your response to at least 3 decimal places. c) Is the null hypothesis rejected at: i) the 10% level of significance? NoYesClick for List ii) the...
12. Consider a statistical inference that test the null hypothesis be Ho: c against H : esuch that c is a positive...
 12. Consider a statistical inference that test the null hypothesis be Ho: c against H : esuch that c is a positive value. The test statistic associated with this mull hypothesis is given by t(b-c)/se(b) At significance level a, the test statistic is smaller than the critical value te(a/2, N - 2), that is iste(a/2, N- 2). Mark the correct alternative: (a) The test p-value increases if we increase c. (b) c does not belong to the estimated confidence interval...
A random sample of 100 urban residents reveals that 50 believe in angels whereas in a...
 A random sample of 100 urban residents reveals that 50 believe in angels whereas in a random sample of 100 rural residents it is found that 65 believe in angels. We test the null hypothesis that the percentage of urban and rural residents who believe in angels is the same against the alternative that it is higher for rural residents. Based on this data, the corresponding test statistic is 2.165 and we reject the null hypothesis at a significance level...
A random sample of 100 urban residents reveals that 50 believe in angels whereas in a...
A random sample of 100 urban residents reveals that 50 believe in angels whereas in a random sample of 100 rural residents it is found that 65 believe in angels. We test the null hypothesis that the percentage of urban and rural residents who believe in angels is the same against the alternative that it is higher for rural residents. Based on this data, the corresponding test statistic is 2.165 and we reject the null hypothesis at a significance level...
 Suppose a random sample of 150 universities is used to test the null hypothesis that the average number of spam emails economics graduate students receive in a month is 46.92. The value of the test statistic is found to be 2.54 if the nullis tested against the alternative hypothesis that the number of spam emails is not 46.92, the smallest significance level at which you can reject the null hypothesis is (Round your answer to four decimal places.)
 9
Test the null hypothesis Ho : u = 3.0against the alternative hypothesis HA: U < 3.0 , based on a random sample of 25 observations drawn from a normally distributed population with ū = 2.8 and o = 0.70. a) What is the value of the test statistic? Round your response to at least 3 decimal places. Number b) What is the appropriate p-value? Round your response to at least 3 decimal places. Number c) Is the null hypothesis...
9
Test the null hypothesis Ho : u = 3.0against the alternative hypothesis HA: U < 3.0 , based on a random sample of 25 observations drawn from a normally distributed population with ū = 2.8 and o = 0.70. a) What is the value of the test statistic? Round your response to at least 3 decimal places. Number b) What is the appropriate p-value? Round your response to at least 3 decimal places. Number c) Is the null hypothesis...
 Identify the null hypothesis. alternative hypothesis, test statistic, decision about the null hypothesis and final conclusion that addresses the original claim Various temperature measurements are recorded at different times for a particular city. The mean of 20 degrees is obtained for 60 temperatures on 60 different days. Assuming that the population standard deviation is 1.5 degrees, test the claim that the population mean is 22 degrees. Use a 0.05 significance level Hou = 22; H1 is u# 22 Test statistic:...
 12. Consider a statistical inference that test the null hypothesis be Ho: c against H : esuch that c is a positive value. The test statistic associated with this mull hypothesis is given by t(b-c)/se(b) At significance level a, the test statistic is smaller than the critical value te(a/2, N - 2), that is iste(a/2, N- 2). Mark the correct alternative: (a) The test p-value increases if we increase c. (b) c does not belong to the estimated confidence interval...
 A random sample of 100 urban residents reveals that 50 believe in angels whereas in a random sample of 100 rural residents it is found that 65 believe in angels. We test the null hypothesis that the percentage of urban and rural residents who believe in angels is the same against the alternative that it is higher for rural residents. Based on this data, the corresponding test statistic is 2.165 and we reject the null hypothesis at a significance level...
Most questions answered within 3 hours.
-
A 0.035 mol sample of a weak acid, HA, is dissolved in 437 mL of
water...
asked 3 minutes ago -
a sample of Ar gas has a volume of 6.30 L with an unknown
pressure. the...
asked 4 minutes ago -
The
serum cholesterol levels of a population of kids follow a normal
distribution with mean 155...
asked 24 minutes ago -
han discusses the racist practice of badlands, a bar
in the Castro
district of San Francisco,...
asked 36 minutes ago -
A sample of final exam scores is normally distributed with a
mean equal to 25 and...
asked 39 minutes ago -
An investor shorts 100 shares of a stock when the share price is
$50 and closes...
asked 43 minutes ago -
LLOP corporation just paid 4$ dividend per share, you expect the
dividend to grow 8% for...
asked 52 minutes ago -
if we subtract 1000 from 0001 is there overflow? (binary)
asked 1 hour ago -
Hello, I need help with the function below, The language I am
using is Ocaml
open...
asked 1 hour ago -
Explain how the presence of glucose represses the gal structural
genes?
asked 1 hour ago -
For the reaction CaI2+2AgNO3⟶2AgI+Ca(NO3)2 how many grams of
silver iodide, AgI, are produced from 56.5 g...
asked 1 hour ago -
Write an equation for hydrolysis via acid catalysis.
Using ethyl acetate, ethyl benzoate, ethyl formate or...
asked 1 hour ago