
can some one help me with 1-d It keep saying it wrong
Homework Answers
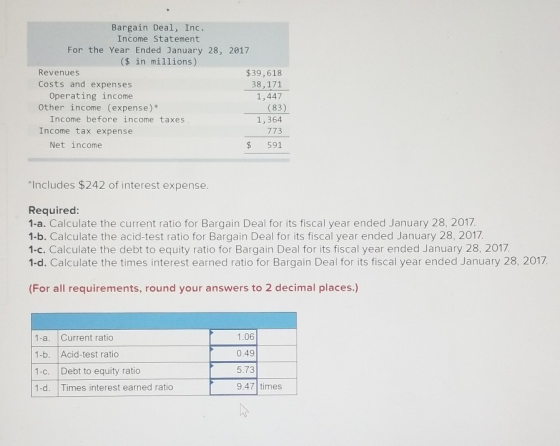
Solution 1 – d :
The formula for calculating the times interest earned ratio is
= Income before Interest and income taxes / Interest Expense
Calculation of other income excluding interest expense :
As per the information given in the question
Interest expense = $ 242 ;
Other Income including Interest expense = $ (83)
Thus other income excluding interest expense = Other Income including Interest expense + Interest expense
= $ (83) + $ 242
= $ 159
Thus other income excluding interest expense = $ 159
Calculation of Income before Interest expense and Income taxes:
Income before Interest expense and Income taxes = Operating Income + other income excluding interest expense
= $ 1,447 + $ 159
= $ 1,606
Thus the Income before Interest expense and Income taxes = $ 1,606
Calculation of times interest earned ratio:
The formula for calculating the times interest earned ratio is
= Income before Interest expense and income taxes / Interest Expense
Applying the available information in the times interest earned ratio formula we have
= $ 1,606 / $ 242
= 6.636364
= 6.64 times ( rounded off to two decimal places )
Thus the times interest earned ratio = 6.64 times
Thus the times interest earned ratio for Bargain Deal for its fiscal year ended January 28, 2017 is = 1.06
Solution 1 – a :
Calculation of Current ratio :
The formula for calculating the Current ratio is
= Total Current Assets / Total Current Liabilities
As per the information available we have
Total Current Assets = $ 10,228 ; Total Current Liabilities = $ 9,625
Applying the above information in the formula for Current ratio we have
= $ 10,228 / $ 9,625
= 1.062649
= 1.06 ( when rounded off to two decimal places )
Thus the Current Ratio for Bargain Deal for its fiscal year ended January 28, 2017 is = 1.06
Solution 1 – b :
Calculation of Acid Test Ratio :
The formula for calculating the Acid Test Ratio is
= [ Cash & Cash equivalents + Short term Investments + Accounts Receivable ( Net ) ] / Total current liabilities
As per the information available in the question we have
Cash & Cash equivalents = $ 2,156 ; Short term Investments = $ 1,323 ;
Accounts Receivable ( Net ) = $ 1,252 ; Total current liabilities = $ 9,625
Applying the above information in the formula for Acid Test Ratio we have
= [ $ 2,156 + $ 1,323 + $ 1,252 ] / $ 9,625
= $ 4,731 / $ 9,625
= 0.491532
= 0.49 ( when rounded off to two decimal places )
Thus the Acid Test Ratio for Bargain Deal for its fiscal year ended January 28, 2017 is = 0.49
Solution 1 – c:
The formula for calculating the Debt Equity Ratio is
= Total Debt / Total Equity
As per the information given in the question we have
Total debt = Total Current Liabilities + Long term liabilities
= $ 9,625 + $ 2,252
= $ 11,877
Total Equity = Shareholder’s equity = $ 2,074
Applying the above information in the formula for debt equity ratio we have
= $ 11,877 / $ 2,074
= 5.726615
= 5.73 ( when rounded off to two decimal places )
Thus the Debt Equity Ratio for Bargain Deal for its fiscal year ended January 28, 2017 is = 5.73
Add Answer to:
can some one help me with 1-d It keep saying it
wrong
Bargain Deal, Inc., is...
Bargain Deal, Inc., is a leading retailer specializing in consumer electronics. A condensed income statement and...
 Bargain Deal, Inc., is a leading retailer specializing in consumer electronics. A condensed income statement and balance sheet for the fiscal year ended January 28, 2017, are shown below. Bargain Deal, Inc. Balance Sheet At January 28, 2017 ($ in millions) Assets Current assets: Cash and cash equivalents Short-term investments Accounts receivable (net) Inventory Other current assets Total current assets Long-term assets Total assets Liabilities and Shareholders' Equity Current liabilities: Accounts payable Other current liabilities Total current liabilities Long-term liabilities...
Bargain Deal, Inc. is a leading retailer specializing in consumer electronics. A condensed income statement and...
 Bargain Deal, Inc. is a leading retailer specializing in consumer electronics. A condensed income statement and balance sheet for the fiscal year ended January 28, 2017, are shown below. Bargain Deal, Inc. Balance Sheet At January 28, 2017 (5 in millions) Assets Current assets: Cash and cash equivalents Short-term investments Accounts receivable (net) Inventory Other current assets Total current assets Long-term assets Total assets Liabilities and Shareholders' Equity Current liabilities: Accounts payable Other current liabilities Total current liabilities Long-term liabilities...
Bargain Deal, Inc., is a leading retailer specializing in consumer electronics. A condensed income statement and...
 Bargain Deal, Inc., is a leading retailer specializing in consumer electronics. A condensed income statement and balance sh fiscal year ended January 28, 2017, are shown below. Bargain Deal, Inc. Balance Sheet At January 28, 2017 ($ in millions) Assets Current assets: Cash and cash equivalents Short-term investments Accounts receivable (net) Inventory Other current assets Total current assets Long-term assets Total assets Liabilities and Shareholders' Equity Current liabilities: Accounts payable Other current liabilities Total current liabilities Long-term liabilities Shareholders' equity...
Bargain Deal, Inc., is a leading retailer specializing in consumer electronics. A condensed income statement and...
 Bargain Deal, Inc., is a leading retailer specializing in consumer electronics. A condensed income statement and balance sheet for the fiscal year ended January 28, 2017, are shown below. Bargain Deal, Inc. Balance Sheet At January 28, 2017 ($ in millions) Assets Current assets: Cash and cash equivalents Short-term investments Accounts receivable (net) Inventory Other current assets Total current assets Long-term assets Total assets Liabilities and Shareholders' Equity Current liabilities: Accounts payable Other current liabilities Total current liabilities Long-term liabilities...
Exercise 3-17 Calculating ratios; Bargain Deal [LO3-8 Bargain Deal, Inc., is a leading retailer specializing in...
 Exercise 3-17 Calculating ratios; Bargain Deal [LO3-8 Bargain Deal, Inc., is a leading retailer specializing in consumer electronics. A condensed income statement and balance sheet for the fiscal year ended January 30, 2016, are shown below Bargain Deal, Inc. Balance Sheet At January 30, 2016 (s in millions) Assets Current assets: Cash and cash equivalents Short-term investments Accounts receivable, net Merchandise inventories Other current assets $ 2,036 1,311 1,192 5,057 404 10,000 3,663 $13,663 Total current assets Long-term assets Total...
Bargain Deal, Inc., is a leading retailer specializing in consumer electronics. A condensed income statement and...
 Bargain Deal, Inc., is a leading retailer specializing in consumer electronics. A condensed income statement and balance sheet for the fiscal year ended January 30, 2016, are shown below Balance Sheet At January 30, 2016 Assets Current assets: Cash and cash equivalents Short-term investnents Accounts receivable, net Merchandise inventories Other current assets 2,136 1,321 1,242 ,067 424 10,190 3,713 Total current assets Long-tern assets Total assets $13,903 Liabilities and Shareholders' Equity Current liabilities: Accounts payable 5,250 4,075 9,325 2,248 2,330...
Bargain Deal, Inc., is a leading retailer specializing in consumer electronics. A condensed income statement and...
Bargain Deal, Inc., is a leading retailer specializing in consumer electronics. A condensed income statement and balance sheet for the fiscal year ended January 30, 2016, are shown below. Bargain Deal, Inc. Balance Sheet At January 30, 2016 ($ in millions) Assets Current assets: Cash and cash equivalents $ 2,066 Short-term investments 1,314 Accounts receivable, net 1,207 Merchandise inventories 5,060 Other current assets 410 Total current assets 10,057 Long-term assets 3,678 Total assets $ 13,735 Liabilities and Shareholders' Equity Current...
Bargain Deal, Inc., is a leading retailer specializing in consumer electronics. A condensed income statement and...
 Bargain Deal, Inc., is a leading retailer specializing in consumer electronics. A condensed income statement and balance sheet for the fiscal year ended January 30, 2016, are shown below. Bargain Deal, Inc. Balance Sheet At January 30, 2016 Assets Current assets Cash and cash equivalents Short-term investnenta Accounts receivable, net Merchandise inventoriea Other current assets 2,136 1,321 1,242 5,067 424 10,190 3,713 Total current assets Long-term assets Total assets $13,903 Liabilities and Shareholders' Equity Current İiabilities Accounts payable 5,250 Other...
lalizing In consumer electronics. A condensed income statement and balance sheet for the Bargain Deal, Inc.,...
 lalizing In consumer electronics. A condensed income statement and balance sheet for the Bargain Deal, Inc., is a leading retailer spec fiscal year ended January 30, 2016, are shown below. 1, Inc Balance Sheet At January 30, 2016 Assets Current assetS1 Cash and cash equivalents Short-term investments Accounts receivable, net Merchandise inventories Other current assets 2,136 1,321 1,242 5,067 424 10,190 3, 713 Total current assetB Long-term assets Total assets $13,903 Liabilities and Shareholder Equity Current liabilities Accounts payable 5,250...
Best Buy Co, Inc., is a leading retailer specializing in consumer electronics. A condensed income statement...
 Best Buy Co, Inc., is a leading retailer specializing in consumer electronics. A condensed income statement and balance sheet for the fiscal year ended January 28, 2017, are shown below. Best Buy Co, Inc. Balance Sheet At January 28, 2017 ($ in millions) Assets Current assets: Cash and cash equivalents Short-term investments Accounts receivable (net) Inventory Other current assets Total current assets Long-term assets Total assets Liabilities and Shareholders' Equity Current liabilities: Accounts payable Other current liabilities Total current liabilities...
 Bargain Deal, Inc., is a leading retailer specializing in consumer electronics. A condensed income statement and balance sheet for the fiscal year ended January 28, 2017, are shown below. Bargain Deal, Inc. Balance Sheet At January 28, 2017 ($ in millions) Assets Current assets: Cash and cash equivalents Short-term investments Accounts receivable (net) Inventory Other current assets Total current assets Long-term assets Total assets Liabilities and Shareholders' Equity Current liabilities: Accounts payable Other current liabilities Total current liabilities Long-term liabilities...
 Bargain Deal, Inc. is a leading retailer specializing in consumer electronics. A condensed income statement and balance sheet for the fiscal year ended January 28, 2017, are shown below. Bargain Deal, Inc. Balance Sheet At January 28, 2017 (5 in millions) Assets Current assets: Cash and cash equivalents Short-term investments Accounts receivable (net) Inventory Other current assets Total current assets Long-term assets Total assets Liabilities and Shareholders' Equity Current liabilities: Accounts payable Other current liabilities Total current liabilities Long-term liabilities...
 Bargain Deal, Inc., is a leading retailer specializing in consumer electronics. A condensed income statement and balance sh fiscal year ended January 28, 2017, are shown below. Bargain Deal, Inc. Balance Sheet At January 28, 2017 ($ in millions) Assets Current assets: Cash and cash equivalents Short-term investments Accounts receivable (net) Inventory Other current assets Total current assets Long-term assets Total assets Liabilities and Shareholders' Equity Current liabilities: Accounts payable Other current liabilities Total current liabilities Long-term liabilities Shareholders' equity...
 Bargain Deal, Inc., is a leading retailer specializing in consumer electronics. A condensed income statement and balance sheet for the fiscal year ended January 28, 2017, are shown below. Bargain Deal, Inc. Balance Sheet At January 28, 2017 ($ in millions) Assets Current assets: Cash and cash equivalents Short-term investments Accounts receivable (net) Inventory Other current assets Total current assets Long-term assets Total assets Liabilities and Shareholders' Equity Current liabilities: Accounts payable Other current liabilities Total current liabilities Long-term liabilities...
 Exercise 3-17 Calculating ratios; Bargain Deal [LO3-8 Bargain Deal, Inc., is a leading retailer specializing in consumer electronics. A condensed income statement and balance sheet for the fiscal year ended January 30, 2016, are shown below Bargain Deal, Inc. Balance Sheet At January 30, 2016 (s in millions) Assets Current assets: Cash and cash equivalents Short-term investments Accounts receivable, net Merchandise inventories Other current assets $ 2,036 1,311 1,192 5,057 404 10,000 3,663 $13,663 Total current assets Long-term assets Total...
 Bargain Deal, Inc., is a leading retailer specializing in consumer electronics. A condensed income statement and balance sheet for the fiscal year ended January 30, 2016, are shown below Balance Sheet At January 30, 2016 Assets Current assets: Cash and cash equivalents Short-term investnents Accounts receivable, net Merchandise inventories Other current assets 2,136 1,321 1,242 ,067 424 10,190 3,713 Total current assets Long-tern assets Total assets $13,903 Liabilities and Shareholders' Equity Current liabilities: Accounts payable 5,250 4,075 9,325 2,248 2,330...
 Bargain Deal, Inc., is a leading retailer specializing in consumer electronics. A condensed income statement and balance sheet for the fiscal year ended January 30, 2016, are shown below. Bargain Deal, Inc. Balance Sheet At January 30, 2016 Assets Current assets Cash and cash equivalents Short-term investnenta Accounts receivable, net Merchandise inventoriea Other current assets 2,136 1,321 1,242 5,067 424 10,190 3,713 Total current assets Long-term assets Total assets $13,903 Liabilities and Shareholders' Equity Current İiabilities Accounts payable 5,250 Other...
 lalizing In consumer electronics. A condensed income statement and balance sheet for the Bargain Deal, Inc., is a leading retailer spec fiscal year ended January 30, 2016, are shown below. 1, Inc Balance Sheet At January 30, 2016 Assets Current assetS1 Cash and cash equivalents Short-term investments Accounts receivable, net Merchandise inventories Other current assets 2,136 1,321 1,242 5,067 424 10,190 3, 713 Total current assetB Long-term assets Total assets $13,903 Liabilities and Shareholder Equity Current liabilities Accounts payable 5,250...
 Best Buy Co, Inc., is a leading retailer specializing in consumer electronics. A condensed income statement and balance sheet for the fiscal year ended January 28, 2017, are shown below. Best Buy Co, Inc. Balance Sheet At January 28, 2017 ($ in millions) Assets Current assets: Cash and cash equivalents Short-term investments Accounts receivable (net) Inventory Other current assets Total current assets Long-term assets Total assets Liabilities and Shareholders' Equity Current liabilities: Accounts payable Other current liabilities Total current liabilities...
Most questions answered within 3 hours.
-
Le Terroir Winery is considering an expansion project to produce
fine wines. The trial expansion will...
asked 27 seconds ago -
The Bahraini public budget experiences deficit in the last
seven years, what are procedures are taken...
asked 7 minutes ago -
You invested $30,000 in a mutual fund at the beginning of the
year when the NAV...
asked 11 minutes ago -
Would you expect the price elasticity of supply for guitars to
be more inelastic in the...
asked 13 minutes ago -
A snowmobile is originally at the point with position vector
30.1 m at 95.0° counterclockwise from...
asked 12 minutes ago -
MAN3240 Organizational Behavior
In one to two paragraphs
6.) How can understanding emotions make me more...
asked 21 minutes ago -
Identify one individual who, in your opinion, is an excellent
leader. List the qualities that this...
asked 18 minutes ago -
For the data set shown below, complete parts (a) through (d)
below. x 3 4 5...
asked 24 minutes ago -
A university administrator working in student housing wants to
determine if the percentage of students residing...
asked 38 minutes ago -
3). Describe human population growth that has occurred in the
past 400 years. Use terms learned...
asked 35 minutes ago -
A
projectile is blue at a target. The distance from the point of
impact to the...
asked 1 hour ago -
Given a 32 bit processor, with 2 MB of physical RAM split into 512
frames. What...
asked 50 minutes ago