Based on the information below please: Calculate TR for each price level Graph the demand curve...
Based on the information below please:
- Calculate TR for each price level
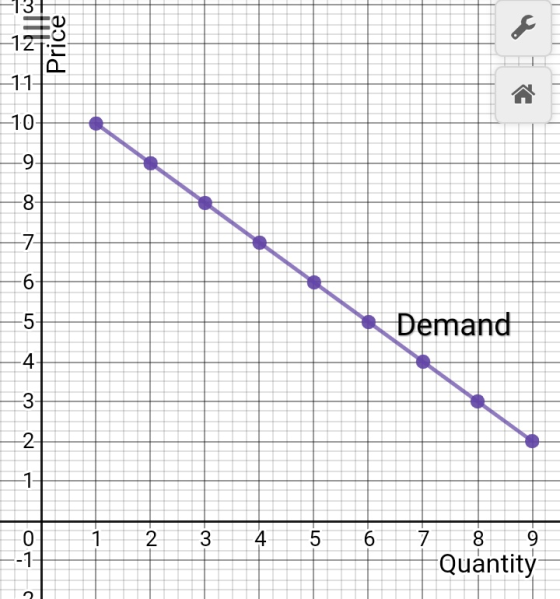
- Graph the demand curve (plotting price and quantity)
- On a graph below – using the same quantity axis measurement- plot the TR- Since the vertical axis where you will plot price for the demand curve and dollar values of TR, if you plot both on the same graph you will find a small demand and the TR way above since those numbers will be much larger.
- Without using the demand elasticity formula, show in what price range your demand is elastic, unit elastic and inelastic
- Explain how you assessed those ranges (without using the formula)
Price Quantity TR
10 1
9 2
8 3
7 4
6 5
5 6
4 7
3 8
2 9
Homework Answers
| Price | Quantity | Total revenue=Price* Quantity |
| 10 | 1 | 10 |
| 9 | 2 | 18 |
| 8 | 3 | 24 |
| 7 | 4 | 28 |
| 6 | 5 | 30 |
| 5 | 6 | 30 |
| 4 | 7 | 28 |
| 3 | 8 | 24 |
| 2 | 9 | 18 |
When MR=0, TR is maximum and demand is unit elastic. As the percentage change in price is equal to the percentage change in quantity demanded.
TR is maximum when Q=6, and P=5
So, Demand is unit elastic when P=5.
Below this price level, demand is inelastic.
Above this price level, demand is elastic.
In other words,
P=$5, Demand is unit elastic.
For 2≤P<5 , demand is inelastic
For 5<P≤10, demand is elastic.
Total revenue curve-

If it helps kindly upvote
For doubts comment below
Add Answer to:
Based on the information below please:
Calculate TR for each price level
Graph the demand curve...
Answer the questions below by using the following demand schedule: Price Quantity Demanded Quantity Supplied $13...
Answer the questions below by using the following demand schedule: Price Quantity Demanded Quantity Supplied $13 585 1305 $12 635 1130 $11 665 980 $10 695 930 $9 705 840 $8 730 730 $7 750 630 $6 780 480 $5 830 360 $4 930 260 • Use the Excel template to calculate and plot the graph of the elasticity of demand between one point and the next. That is, plot A-to-B, B-to-C etc. Upon plotting the graph, determine the price...
9. Elasticity and total revenue The following graph shows the demand curve for kumquats. Points A,...
 9. Elasticity and total revenue The following graph shows the demand curve for kumquats. Points A, B, C, and D mark price ranges over which you will be asked to calculate the price elasticity of demand for this good. Use the purple rectangle labeled Total Revenue (diamond symbols) to compute total revenue at various prices along the demand curve. To see the area of the Total Revenue rectangle, select the shaded area with your mouse. You will not be graded...
Figure: The Demand Curve Figure: The Demand Curve Price 3104 Quantity Use Figure: The Demand Curve....
 Figure: The Demand Curve Figure: The Demand Curve Price 3104 Quantity Use Figure: The Demand Curve. By the midpoint method, the price elasticity of demand between $6 and $7 is approximately 1.86. 0.19. 1.00 5.40. If the absolute value of the price elasticity of demand is greater than 1: percentage changes in the price will lead to equal percentage changes in the quantity demanded. small percentage changes in the price will lead to much larger percentage changes in the quantity...
The following graph shows the demand curve for trekking poles. Points L, M, N, and O...
 The following graph shows the demand curve for trekking poles. Points L, M, N, and O mark price ranges over which you will be asked to calculate the price elasticity of demand for this good Use the purple rectangle labeled Total Revenue (diamond symbols) to compute total revenue at various prices along the demand curve. To see the area of the Total Revenue rectangle, select the shaded area with your mouse. You will not be graded on where you place...
Graph the demand curve for chiropractic visits using the points given in the table below. Answer...
Graph the demand curve for chiropractic visits using the points given in the table below. Answer the questions below and interpret results. (What do results mean? Are they elastic? Inelastic? P Q 20 4 40 3 60 2 80 1 If price rises from $20 to 40, what is the price elasticity of demand at that point and what happens to the quantity demanded of chiropractic visits? Is this elastic or inelastic? If price rises from $60 to $80? $40...
True or False: The value of the price elasticity of demand is not equal to the...
 True or False: The value of the
price elasticity of demand is not equal to the slope of the demand
curve.
Denad a liciy VU 180- し し Demand 21 1 QUANTITY (Units) For each region on the graph given in the following table, use the elasticity formula to identify whether the demand for this good is elastic, (approximately) unit elastic, or inelastic. RegionE Elastic Inelastic Unit Elastic Between Y and Z Between w and X。 Between X and Y
True or False: The value of the
price elasticity of demand is not equal to the slope of the demand
curve.
Denad a liciy VU 180- し し Demand 21 1 QUANTITY (Units) For each region on the graph given in the following table, use the elasticity formula to identify whether the demand for this good is elastic, (approximately) unit elastic, or inelastic. RegionE Elastic Inelastic Unit Elastic Between Y and Z Between w and X。 Between X and Y
The following graph shows the demand curve for kumquats in Chicago. You can use the red rectangle labeled Total Revenue...
 The following graph shows the demand curve for kumquats in Chicago. You can use the red rectangle labeled Total Revenue (cross symbols) to compute total revenue at various prices along the demand curve. To see the area of the Total Revenue rectangle, scroll over the shaded area with your mouse. You will not be graded on where you place the rectangle PRICE (Dollars per pound) 12 Total Revenue 10 D 6 X C B X 4 xA 2 Demand 0...
for each of the following, draw a simple linear demand curve that coincides with the (NOT...
 for each of the following, draw a simple linear demand curve that coincides with the (NOT Cross-price). Be sure to label yourses. Once you have drawn the grupe associated quantity as Q. Then pick a higher or lower rice and labelitas Pu Labdi of selecting two prices and quantities is to show yourself why the demand curve's elasticity op me to goods with this type of demand and curve that coincides with the indicated type of price elasticity of demand...
Suppose that the price elasticity of demand of a good is -3. Its demand is _________...
Suppose that the price elasticity of demand of a good is -3. Its demand is _________ and the percentage change in its quantity demanded is ________ than the percentage change in its price. A. Elastic: Smaller B. Elastic: Greater C. Inelastic: Smaller D. Inelastic: Greater Which of the following is not a determinant of the price elasticity of demand? A. Availability of substitutes B. Degree of necessity C. Cost relative to income D. Availability of inputs With a(n) ______ demand,...
om/courses/2456531/quizzes/5192042/take Question 6 1 pts The price elasticity of demand for a completely vertical demand curve...
 om/courses/2456531/quizzes/5192042/take Question 6 1 pts The price elasticity of demand for a completely vertical demand curve is unitary elastic O perfectly elastic O elastic O perfectly inelastic 1 pts Question 7 If a 3 percent reduction in the price of a good produces a 5 percent increase in the quantity demanded, the price elasticity of demand over this range of the demand curve is unitary elastic
 9. Elasticity and total revenue The following graph shows the demand curve for kumquats. Points A, B, C, and D mark price ranges over which you will be asked to calculate the price elasticity of demand for this good. Use the purple rectangle labeled Total Revenue (diamond symbols) to compute total revenue at various prices along the demand curve. To see the area of the Total Revenue rectangle, select the shaded area with your mouse. You will not be graded...
 Figure: The Demand Curve Figure: The Demand Curve Price 3104 Quantity Use Figure: The Demand Curve. By the midpoint method, the price elasticity of demand between $6 and $7 is approximately 1.86. 0.19. 1.00 5.40. If the absolute value of the price elasticity of demand is greater than 1: percentage changes in the price will lead to equal percentage changes in the quantity demanded. small percentage changes in the price will lead to much larger percentage changes in the quantity...
 The following graph shows the demand curve for trekking poles. Points L, M, N, and O mark price ranges over which you will be asked to calculate the price elasticity of demand for this good Use the purple rectangle labeled Total Revenue (diamond symbols) to compute total revenue at various prices along the demand curve. To see the area of the Total Revenue rectangle, select the shaded area with your mouse. You will not be graded on where you place...
 True or False: The value of the
price elasticity of demand is not equal to the slope of the demand
curve.
Denad a liciy VU 180- し し Demand 21 1 QUANTITY (Units) For each region on the graph given in the following table, use the elasticity formula to identify whether the demand for this good is elastic, (approximately) unit elastic, or inelastic. RegionE Elastic Inelastic Unit Elastic Between Y and Z Between w and X。 Between X and Y
True or False: The value of the
price elasticity of demand is not equal to the slope of the demand
curve.
Denad a liciy VU 180- し し Demand 21 1 QUANTITY (Units) For each region on the graph given in the following table, use the elasticity formula to identify whether the demand for this good is elastic, (approximately) unit elastic, or inelastic. RegionE Elastic Inelastic Unit Elastic Between Y and Z Between w and X。 Between X and Y
 The following graph shows the demand curve for kumquats in Chicago. You can use the red rectangle labeled Total Revenue (cross symbols) to compute total revenue at various prices along the demand curve. To see the area of the Total Revenue rectangle, scroll over the shaded area with your mouse. You will not be graded on where you place the rectangle PRICE (Dollars per pound) 12 Total Revenue 10 D 6 X C B X 4 xA 2 Demand 0...
 for each of the following, draw a simple linear demand curve that coincides with the (NOT Cross-price). Be sure to label yourses. Once you have drawn the grupe associated quantity as Q. Then pick a higher or lower rice and labelitas Pu Labdi of selecting two prices and quantities is to show yourself why the demand curve's elasticity op me to goods with this type of demand and curve that coincides with the indicated type of price elasticity of demand...
 om/courses/2456531/quizzes/5192042/take Question 6 1 pts The price elasticity of demand for a completely vertical demand curve is unitary elastic O perfectly elastic O elastic O perfectly inelastic 1 pts Question 7 If a 3 percent reduction in the price of a good produces a 5 percent increase in the quantity demanded, the price elasticity of demand over this range of the demand curve is unitary elastic
Most questions answered within 3 hours.
-
You are attempting to calculate a firm’s free cash flow to
equity. You know the following...
asked 27 minutes ago -
the following reaction occurs in a balloon containing
N2O2 gas
N2O4(g)=2NO2(g)
will the volume of the...
asked 1 hour ago -
answer the questions throughout this program
public class Day implements Comparable {
Private Boolean atWork;...
asked 1 hour ago -
This is C++ code for parking fee management program
#include <iostream>
#include <iomanip>
using namespace std;...
asked 1 hour ago -
The free energy change for the following reaction at 25 °C, when
[Sn2+] = 1.17 M...
asked 3 hours ago -
An MNE is this kind of industry when competition in one country
is essentially independent of...
asked 4 hours ago -
. For this set of questions, determine what
proportion of a normal distribution is located betweeneach...
asked 5 hours ago -
A college student is employed as a door-to-door newspaper
salesman. Historical data suggests that the student...
asked 6 hours ago -
MATLAB HW 11 problem using Switch Case and Input commands
Write a script file that calculates...
asked 5 hours ago -
Considering gravitational time dilation, calculate the time that
passes in Earth’s surface while 1 hour passes...
asked 6 hours ago -
Minitab Problem: Take the Lake Hume June rainfall data and find
use the processes outlined in...
asked 7 hours ago -
X Company is trying to decide whether to continue using old
equipment to make Product A...
asked 7 hours ago