

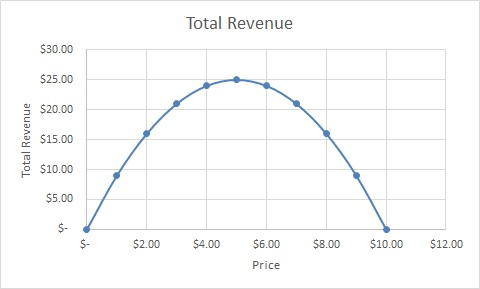
On the following graph, use the green point (triangle symbol) to plot monthly total revenue at prices of $2, $3, $4, $5, $6, $7, and $8 per pound of kumquats. Be sure to use all of the points provided. Line segments will automatically connect the points. TOTAL REVENUE (Millions of dollars per month) 28 Total Revenue 26 24 22 18 16 14. 12 1 2 3 4 5 6 7 8 9 PRICE (Dollars per pound) Clear All Help 20
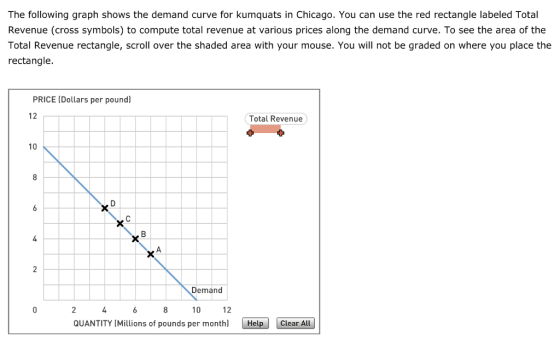
According to the midpoint method, the price elasticity of demand between points B and A is approximately Suppose the price of kumquats is currently $5 per pound. Because the price elasticity of demand between points D and C is , a $1-per-pound rise in price will lead to in total revenue per month. In order for a price decrease to cause an increase in total revenue, demand must be unit elastic inelastic elastic
Homework Answers
Refer the attached picture for total revenue and total revenue graph

Refer the attached picture for Revenue curve
Mid point elasticity can be determined using the following formula


| Quantity | Price | |
|---|---|---|
| A | 7 | 3 |
| B | 6 | 4 |


According to Mid-Point method the elasticity of demand between A and B is approximately -0.5384.
| Quantity | Price | |
|---|---|---|
| C | 5 | 5 |
| D | 4 | 6 |


Suppose the price of Kumquats is $ 5 per pound. Because the price elasticity between point D and C is 1.22, a $ 1 per pound rise in price will rise in price will lead to decline($1) in total revenue per month.
In order for a price decrease to cause an increase in total revenue, demand must be Elastic.
Please contact if having any query. My humble request to help me it mean a lot to me. Please help. Thank you.
Add Answer to:
The following graph shows the demand curve for kumquats in Chicago. You can use the red rectangle labeled Total Revenue...
9. Elasticity and total revenue The following graph shows the demand curve for kumquats. Points A,...
 9. Elasticity and total revenue The following graph shows the demand curve for kumquats. Points A, B, C, and D mark price ranges over which you will be asked to calculate the price elasticity of demand for this good. Use the purple rectangle labeled Total Revenue (diamond symbols) to compute total revenue at various prices along the demand curve. To see the area of the Total Revenue rectangle, select the shaded area with your mouse. You will not be graded...
3. Total and average revenue of a monopolist Аа аа Suppose that Manuel Stein is the...
 3. Total and average revenue of a monopolist Аа аа Suppose that Manuel Stein is the only seller of kumquats in a small town. The following graph shows the demand and marginal revenue (MR) curves facing Manuel. You can use the red rectangle labeled Total Revenue (cross symbols) to compute total revenue at various prices along the demand curve. To see the area of the Total Revenue rectangle, scroll over the shaded area with your mouse. You will not be...
6. Elasticity and total revenue The following graph shows the daily demand curve for bikes in...
 6. Elasticity and total revenueThe following graph shows the daily demand curve for bikes in New York City.Use the green rectangle (triangle symbols) to compute total revenue at various prices along the demand curve.Note: You will not be graded on any changes made to this graph.According to the midpoint method, the price elasticity of demand between points A and B is approximately _______ Suppose the price of bikes is currently $ 200 per bike, shown as point A on the initial graph....
5. Elasticity and total revenue The following graph shows the daily demand curve for bikes in Miami. Use the green rectangle (triangle symbols) to compute total revenue at various prices along the demand curve. Note: You will not be graded on any changes
 5. Elasticity and total revenueThe following graph shows the daily demand curve for bikes in Miami.Use the green rectangle (triangle symbols) to compute total revenue at various prices along the demand curve.Note: You will not be graded on any changes made to this graph.On the following graph, use the green point (triangle symbol) to plot the annual total revenue when the market price is $50, $75, $100, $125, $150, $175, and $200 per bike. According to the midpoint method, the price...
6. Elasticity and total revenue The following graph shows the daily demand curve for bikes in...
 6. Elasticity and total revenueThe following graph shows the daily demand curve for bikes in Dallas.Use the green rectangle (triangle symbols) to compute total revenue at various prices along the demand curve.Note: You will not be graded on any changes made to this graph.On the following graph, use the green point (triangle symbol) to plot the annual total revenue when the market price is $ 50, $ 75, $ 100, $ 125, $ 150, $ 175, and $ 200 per...
The following graph shows the demand curve for trekking poles. Points L, M, N, and O...
 The following graph shows the demand curve for trekking poles. Points L, M, N, and O mark price ranges over which you will be asked to calculate the price elasticity of demand for this good Use the purple rectangle labeled Total Revenue (diamond symbols) to compute total revenue at various prices along the demand curve. To see the area of the Total Revenue rectangle, select the shaded area with your mouse. You will not be graded on where you place...
6. Elasticity and total revenue The following graph shows the daily demand curve for bikes in...
 6. Elasticity and total revenue The following graph shows the daily demand curve for bikes in Denver Use the green rectangle (triangle symbols) to compute total revenue at various prices along the demand cur Note: You will not be graded on any changes made to this graph.On the following graph, use the green point (triangle symbol) to plot the annual total revenue when the market price is $50, $75, $100, $125, $150, $175, and $200 per bike. According to the midpoint method, the price...
5. The variation in elasticity and total revenue along a demand curve The following graph shows...
 5. The variation in elasticity and total revenue along a demand curve The following graph shows the daily demand curve for bippitybops in New York City. Use the green rectangle (triangle symbols) to compute total revenue at various prices along the demand curve. Note: You will not be graded on any changes made to this graph. 100 Total Revenue 80 O 70 2 60 Q 50 T O 40 30 20 10 Demand 0 6 12 18 24 30 36...
6. Elasticity and total revenue The following graph shows the dally demand curve for bikes in...
 6. Elasticity and total revenue The following graph shows the dally demand curve for bikes in New York City. Use the green rectangle (triangle symbols) to compute total revenue at various prices along the demand curve Note: You will not be graded on any changes made to this graph. 300 275 250 225 Total Revenue 175 150 125 100 75 50 03 6912 1518 21 24 27 30 33 36 QUANTITY (Bikes) On the following graph, use the green point...
4. Elasticity and total revenue The following graph shows the daily demand curve for bippitybops in...
 4. Elasticity and total revenue The following graph shows the daily demand curve for bippitybops in Dallas. Use the green rectangle (triangle symbols) to compute total revenue at various prices along the demand curve Note: You will not be graded on any changes made to this graph. 240 Total Revenue 200 180 140 120 O 100 0 60 40 20 0 18 27 3 45 54 63 72 90 99 108 QUANTITY (Bippitybops) On the following graph, use the green...
 9. Elasticity and total revenue The following graph shows the demand curve for kumquats. Points A, B, C, and D mark price ranges over which you will be asked to calculate the price elasticity of demand for this good. Use the purple rectangle labeled Total Revenue (diamond symbols) to compute total revenue at various prices along the demand curve. To see the area of the Total Revenue rectangle, select the shaded area with your mouse. You will not be graded...
 3. Total and average revenue of a monopolist Аа аа Suppose that Manuel Stein is the only seller of kumquats in a small town. The following graph shows the demand and marginal revenue (MR) curves facing Manuel. You can use the red rectangle labeled Total Revenue (cross symbols) to compute total revenue at various prices along the demand curve. To see the area of the Total Revenue rectangle, scroll over the shaded area with your mouse. You will not be...
 The following graph shows the demand curve for trekking poles. Points L, M, N, and O mark price ranges over which you will be asked to calculate the price elasticity of demand for this good Use the purple rectangle labeled Total Revenue (diamond symbols) to compute total revenue at various prices along the demand curve. To see the area of the Total Revenue rectangle, select the shaded area with your mouse. You will not be graded on where you place...
 6. Elasticity and total revenue The following graph shows the daily demand curve for bikes in Denver Use the green rectangle (triangle symbols) to compute total revenue at various prices along the demand cur Note: You will not be graded on any changes made to this graph.On the following graph, use the green point (triangle symbol) to plot the annual total revenue when the market price is $50, $75, $100, $125, $150, $175, and $200 per bike. According to the midpoint method, the price...
 5. The variation in elasticity and total revenue along a demand curve The following graph shows the daily demand curve for bippitybops in New York City. Use the green rectangle (triangle symbols) to compute total revenue at various prices along the demand curve. Note: You will not be graded on any changes made to this graph. 100 Total Revenue 80 O 70 2 60 Q 50 T O 40 30 20 10 Demand 0 6 12 18 24 30 36...
 6. Elasticity and total revenue The following graph shows the dally demand curve for bikes in New York City. Use the green rectangle (triangle symbols) to compute total revenue at various prices along the demand curve Note: You will not be graded on any changes made to this graph. 300 275 250 225 Total Revenue 175 150 125 100 75 50 03 6912 1518 21 24 27 30 33 36 QUANTITY (Bikes) On the following graph, use the green point...
 4. Elasticity and total revenue The following graph shows the daily demand curve for bippitybops in Dallas. Use the green rectangle (triangle symbols) to compute total revenue at various prices along the demand curve Note: You will not be graded on any changes made to this graph. 240 Total Revenue 200 180 140 120 O 100 0 60 40 20 0 18 27 3 45 54 63 72 90 99 108 QUANTITY (Bippitybops) On the following graph, use the green...
Most questions answered within 3 hours.
-
Consider a group of bacteria that you are trying to classify as
either the same species...
asked 4 minutes ago -
You have the following rates of return for a risky portfolio for
several recent years. Assume...
asked 11 minutes ago -
an aqueous solution of Na2CrO4 at 25
degrees C is added to an aqueous solution containing...
asked 12 minutes ago -
A rotating space station is said to create “artificial
gravity”—a loosely-defined term used for an acceleration...
asked 31 minutes ago -
The following MIPS branching pseudo instruction
bge $s0, $s1, Label # branch to Label if $s0...
asked 33 minutes ago -
In cation exchange chromatography, the beads are covalently
linked to a ________chemical and a ______________ ion...
asked 21 minutes ago -
A block in the shape of a rectangular solid has a
cross-sectional area of 4.58 cm2...
asked 35 minutes ago -
Which of the following countries has abolished tied aid?
Select one:
a. France
b. The United...
asked 31 minutes ago -
ASAP using c++ vectors Create a vector of characters and ask the
user to enter their...
asked 50 minutes ago -
On December 31, 2018, Wellstone Company reported net income of
$76,000 and sales of $215,000. The...
asked 48 minutes ago -
Question #1
Consider the following potential investment, which has the same
risk as a firm’s other...
asked 51 minutes ago -
Globalization = Standardization + Localization: What does this
equation really mean about optimizing a firm’s offerings...
asked 49 minutes ago