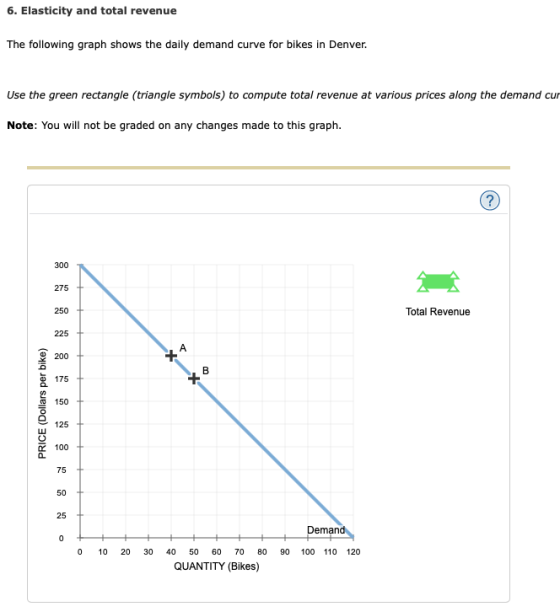

6. Elasticity and total revenue
The following graph shows the daily demand curve for bikes in Denver
Use the green rectangle (triangle symbols) to compute total revenue at various prices along the demand cur
Note: You will not be graded on any changes made to this graph.
On the following graph, use the green point (triangle symbol) to plot the annual total revenue when the market price is $50, $75, $100, $125, $150, $175, and $200 per bike.
According to the midpoint method, the price elasticity of demand between points A and B is approximately Suppose the price of bikes is currently $200 per bike, shown as point A on the initial graph. Because the demand between points A and B is ,a $25-per-bike decrease in price will lead to in total revenue per day.
In general, in order for a price increase to cause a decrease in total revenue, demand must be
Homework Answers
Ans:
| Price ($) | Quantity ( Bikes) | Total Revenue |
| 50 | 100 | 5000 |
| 75 | 90 | 6750 |
| 100 | 80 | 8000 |
| 125 | 70 | 8750 |
| 150 | 60 | 9000 |
| 175 | 50 | 8750 |
| 200 | 40 | 8000 |

Answer to the Blank 1 : PED between point A and B is approximately 1.66
Explanation:
PED between point A and B = ![Delta Q /Delta P * [(P1+P2)/(Q1+Q2)]](http://img.homeworklib.com/questions/9fb11980-7040-11ea-a133-83437186361e.png?x-oss-process=image/resize,w_560)
= { ( 50- 40 ) / (200 -175 )} * { (200 +175 ) / ( 40 +50 )}
= (10 / 25 ) * ( 375 / 90 )
= 0.4 * 4.1666
= 1.66
Answer to the Blank 2 : Elastic
Answer to the Blank 3 : Increase in total revenue
Answer to the Blank 4 : Elastic
Add Answer to:
6. Elasticity and total revenue The following graph shows the daily demand curve for bikes in...
6. Elasticity and total revenue The following graph shows the daily demand curve for bikes in...
 6. Elasticity and total revenueThe following graph shows the daily demand curve for bikes in Dallas.Use the green rectangle (triangle symbols) to compute total revenue at various prices along the demand curve.Note: You will not be graded on any changes made to this graph.On the following graph, use the green point (triangle symbol) to plot the annual total revenue when the market price is $ 50, $ 75, $ 100, $ 125, $ 150, $ 175, and $ 200 per...
6. Elasticity and total revenue The following graph shows the daily demand curve for bikes in...
 6. Elasticity and total revenueThe following graph shows the daily demand curve for bikes in New York City.Use the green rectangle (triangle symbols) to compute total revenue at various prices along the demand curve.Note: You will not be graded on any changes made to this graph.According to the midpoint method, the price elasticity of demand between points A and B is approximately _______ Suppose the price of bikes is currently $ 200 per bike, shown as point A on the initial graph....
The following graph shows the daily demand curve for bikes in Detroit.
 6. Elasticity and total revenue The following graph shows the daily demand curve for bikes in Detroit. Use the green rectangle (triangle symbols) to compute total revenue at various prices along the demand curve. Note: You will not be graded on any changes made to this graph. On the following graph, use the green point (triangle symbol) to plot the annual total revenue when the market price is $50, $75, $100, $125, $150, $175, and $200 per bike. According to the midpoint method, the price...
The following graph shows the daily demand curve for bikes in Detroit.
 The following graph shows the daily demand curve for bikes in Detroit. Use the green rectangle (triangle symbols) to compute total revenue at various prices along the demand curve. Note: You will not be graded on any changes made to this graph.On the following graph, use the green point (triangle symbol) to plot the annual total revenue when the market price is $50, $75, $100, $125, $150, $175, and $200 per bike. According to the midpoint method, the price elasticity of demand between...
The following graph shows the daily demand curve for bikes in San Francisco.
 6. Elasticity and total revenueThe following graph shows the daily demand curve for bikes in San Francisco.Use the green rectangle (triangle symbols) to compute total revenue at various prices along the demand curve.Note: You will not be graded on any changes made to this graph.On the following graph, use the green point (triangle symbol) to plot the annual total revenue when the market price is $ 50,575, $ 100, $ 125, $ 150, $ 175, and $ 200 per bike.According...
5. Elasticity and total revenue The following graph shows the daily demand curve for bikes in Miami. Use the green rectangle (triangle symbols) to compute total revenue at various prices along the demand curve. Note: You will not be graded on any changes
 5. Elasticity and total revenueThe following graph shows the daily demand curve for bikes in Miami.Use the green rectangle (triangle symbols) to compute total revenue at various prices along the demand curve.Note: You will not be graded on any changes made to this graph.On the following graph, use the green point (triangle symbol) to plot the annual total revenue when the market price is $50, $75, $100, $125, $150, $175, and $200 per bike. According to the midpoint method, the price...
6. Elasticity and total revenue The following graph shows the dally demand curve for bikes in...
 6. Elasticity and total revenue The following graph shows the dally demand curve for bikes in New York City. Use the green rectangle (triangle symbols) to compute total revenue at various prices along the demand curve Note: You will not be graded on any changes made to this graph. 300 275 250 225 Total Revenue 175 150 125 100 75 50 03 6912 1518 21 24 27 30 33 36 QUANTITY (Bikes) On the following graph, use the green point...
The following graph shows the daily demand curve for bikes in San Diego. Use the green...
 The following graph shows the daily demand curve for bikes in San Diego.Use the green rectangle (triangle symbols) to compute total revenue at various prices along the demand curve.Note: You will not be graded on any changes made to this graph.According to the midpoint method, the price elasticity of demand between points A and B is approximately _______ Suppose the price of bikes is currently $ 125 per bike, shown as point A on the initial graph. Because the demand between...
please cleary label answers.The following graph shows the daily demand curve for bikes in Miami....
 The following graph shows the daily demand curve for bikes in Miami.Use the green rectangle (triangle symbols) to compute total revenue at various prices along the demand curve.Note: You will not be graded on any changes made to this graph.According to the midpoint method, the price elasticity of demand between points A and B is approximately _______ Suppose the price of bikes is currently $ 30 per bike, shown as point A on the initial graph. Because the demand between points...
The following graph shows the daily demand curve for bikes in New York City. Use the...
 The following graph shows the daily demand curve for bikes in New York City. Use the green rectangle (triangle symbols) to compute total revenue at various prices along the demand curve. Note: You will not be graded on any changes made to this graph. ? 300 275 250 Total Revenue 225 200 175 PRICE (Dollars per bike) 150 A 125 B 100 75 50 25 Demand 0 0 3 6 9 27 30 33 36 12 15 18 21 24...
 6. Elasticity and total revenue The following graph shows the dally demand curve for bikes in New York City. Use the green rectangle (triangle symbols) to compute total revenue at various prices along the demand curve Note: You will not be graded on any changes made to this graph. 300 275 250 225 Total Revenue 175 150 125 100 75 50 03 6912 1518 21 24 27 30 33 36 QUANTITY (Bikes) On the following graph, use the green point...
 The following graph shows the daily demand curve for bikes in San Diego.Use the green rectangle (triangle symbols) to compute total revenue at various prices along the demand curve.Note: You will not be graded on any changes made to this graph.According to the midpoint method, the price elasticity of demand between points A and B is approximately _______ Suppose the price of bikes is currently $ 125 per bike, shown as point A on the initial graph. Because the demand between...
 The following graph shows the daily demand curve for bikes in New York City. Use the green rectangle (triangle symbols) to compute total revenue at various prices along the demand curve. Note: You will not be graded on any changes made to this graph. ? 300 275 250 Total Revenue 225 200 175 PRICE (Dollars per bike) 150 A 125 B 100 75 50 25 Demand 0 0 3 6 9 27 30 33 36 12 15 18 21 24...
Most questions answered within 3 hours.
-
D. A student completed 20 courses in the School of Arts and
Sciences. Her grades in...
asked 1 hour ago -
teo
pucks moving on a frictionless air table are about to collide. the
1.5 kg puck...
asked 1 hour ago -
Problem #1
The area between Z = 0 and Z = 2.50
The area between Z...
asked 3 hours ago -
1. What is the meaning of the term communication style?
2. What are the benefits to...
asked 2 hours ago -
9.) You are buying a car that cost $26,500. You make payments of
$412 each month...
asked 2 hours ago -
. Suppose a discrete random variable has probability
distribution
P(x) = .2 if x = 0...
asked 4 hours ago -
Under the influence of its drive force, a snowmobile is moving
at a constant velocity along...
asked 4 hours ago -
Why do organizations decline? What steps can top
management take to halt, decline, and restore organizational...
asked 4 hours ago -
What mechanisms Drive speciation??
(I.e. what was Dawins theory on the orgin of species, and how...
asked 5 hours ago -
The manager at a car assembly plant believes that the mean
assembly time for a car...
asked 6 hours ago -
Which of the following is true of electron capture?
A) It decreases the nuclide's mass number...
asked 8 hours ago -
Assuming an efficiency of 43.10%, calculate the actual yield of
magnesium nitrate formed from 114.9 g...
asked 8 hours ago