The following graph shows the daily demand curve for bikes in San Francisco.
6. Elasticity and total revenue
The following graph shows the daily demand curve for bikes in San Francisco.
Use the green rectangle (triangle symbols) to compute total revenue at various prices along the demand curve.
Note: You will not be graded on any changes made to this graph.

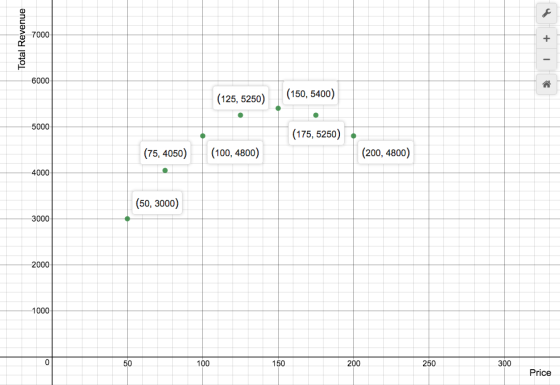
On the following graph, use the green point (triangle symbol) to plot the annual total revenue when the market price is $ 50,575, $ 100, $ 125, $ 150, $ 175, and $ 200 per bike.

According to the midpoint method, the price elasticity of demand between points A and B is approximately _______ .
Suppose the price of bikes is currently $ 125 per bike, shown as point A on the initial graph. Because the demand between points A and B is _______ , a $ 25-per-bike decrease in price will lead to _______ in total revenue per day.
In general, in order for a price increase to cause an increase in total revenue, demand must be _______ .
Homework Answers
Total Revenue(TR) = Quantity x Price
The demand curve given is P = 300 - (25/6)Q ==> Q = 72 - (6/25)P.
Thus, TR = (72 - (6/25)P)P = 72P - (6/25)P^2. Following table gives the value of TR for various P for the plot.
| Price, P | Quantity, Q | Total Revenue, TR |
| 50 | 60 | 3000 |
| 75 | 54 | 4050 |
| 100 | 48 | 4800 |
| 125 | 42 | 5250 |
| 150 | 36 | 5400 |
| 175 | 30 | 5250 |
| 200 | 24 | 4800 |
The price elasticity of demand = % change in Quantity/% change in price.
Using the midpoint method,
% change in Quantity = (Q2-Q1)/((Q1+Q2)/2) = (48-42)/(45) = 2/15
% change in Quantity = (P2-P1)/((P1+P2)/2) = (125-100)/112.5 = 25/112.5 = 1/4.5 = 2/9.
The price elasticity of demand = (2/15)/(2/9) = 9/15 = 0.6.
THE REST OF THE ANSWERS ARE CORRECTLY MARKED
Add Answer to:
The following graph shows the daily demand curve for bikes in San Francisco.
The following graph shows the daily demand curve for bikes in San Diego. Use the green...
 The following graph shows the daily demand curve for bikes in San Diego.Use the green rectangle (triangle symbols) to compute total revenue at various prices along the demand curve.Note: You will not be graded on any changes made to this graph.According to the midpoint method, the price elasticity of demand between points A and B is approximately _______ Suppose the price of bikes is currently $ 125 per bike, shown as point A on the initial graph. Because the demand between...
The following graph shows the daily demand curve for bikes in Detroit.
 6. Elasticity and total revenue The following graph shows the daily demand curve for bikes in Detroit. Use the green rectangle (triangle symbols) to compute total revenue at various prices along the demand curve. Note: You will not be graded on any changes made to this graph. On the following graph, use the green point (triangle symbol) to plot the annual total revenue when the market price is $50, $75, $100, $125, $150, $175, and $200 per bike. According to the midpoint method, the price...
The following graph shows the daily demand curve for bikes in Detroit.
 The following graph shows the daily demand curve for bikes in Detroit. Use the green rectangle (triangle symbols) to compute total revenue at various prices along the demand curve. Note: You will not be graded on any changes made to this graph.On the following graph, use the green point (triangle symbol) to plot the annual total revenue when the market price is $50, $75, $100, $125, $150, $175, and $200 per bike. According to the midpoint method, the price elasticity of demand between...
6. Elasticity and total revenue The following graph shows the daily demand curve for bikes in...
 6. Elasticity and total revenueThe following graph shows the daily demand curve for bikes in Dallas.Use the green rectangle (triangle symbols) to compute total revenue at various prices along the demand curve.Note: You will not be graded on any changes made to this graph.On the following graph, use the green point (triangle symbol) to plot the annual total revenue when the market price is $ 50, $ 75, $ 100, $ 125, $ 150, $ 175, and $ 200 per...
6. Elasticity and total revenue The following graph shows the daily demand curve for bikes in...
 6. Elasticity and total revenue The following graph shows the daily demand curve for bikes in Denver Use the green rectangle (triangle symbols) to compute total revenue at various prices along the demand cur Note: You will not be graded on any changes made to this graph.On the following graph, use the green point (triangle symbol) to plot the annual total revenue when the market price is $50, $75, $100, $125, $150, $175, and $200 per bike. According to the midpoint method, the price...
5. Elasticity and total revenue The following graph shows the daily demand curve for bikes in Miami. Use the green rectangle (triangle symbols) to compute total revenue at various prices along the demand curve. Note: You will not be graded on any changes
 5. Elasticity and total revenueThe following graph shows the daily demand curve for bikes in Miami.Use the green rectangle (triangle symbols) to compute total revenue at various prices along the demand curve.Note: You will not be graded on any changes made to this graph.On the following graph, use the green point (triangle symbol) to plot the annual total revenue when the market price is $50, $75, $100, $125, $150, $175, and $200 per bike. According to the midpoint method, the price...
6. Elasticity and total revenue The following graph shows the dally demand curve for bikes in...
 6. Elasticity and total revenue The following graph shows the dally demand curve for bikes in New York City. Use the green rectangle (triangle symbols) to compute total revenue at various prices along the demand curve Note: You will not be graded on any changes made to this graph. 300 275 250 225 Total Revenue 175 150 125 100 75 50 03 6912 1518 21 24 27 30 33 36 QUANTITY (Bikes) On the following graph, use the green point...
The following graph shows the daily demand curve for bikes in New York City. Use the...
 The following graph shows the daily demand curve for bikes in New York City. Use the green rectangle (triangle symbols) to compute total revenue at various prices along the demand curve. Note: You will not be graded on any changes made to this graph. ? 300 275 250 Total Revenue 225 200 175 PRICE (Dollars per bike) 150 A 125 B 100 75 50 25 Demand 0 0 3 6 9 27 30 33 36 12 15 18 21 24...
please cleary label answers.The following graph shows the daily demand curve for bikes in Miami....
 The following graph shows the daily demand curve for bikes in Miami.Use the green rectangle (triangle symbols) to compute total revenue at various prices along the demand curve.Note: You will not be graded on any changes made to this graph.According to the midpoint method, the price elasticity of demand between points A and B is approximately _______ Suppose the price of bikes is currently $ 30 per bike, shown as point A on the initial graph. Because the demand between points...
6. Elasticity and total revenue The following graph shows the daily demand curve for bikes in...
 6. Elasticity and total revenueThe following graph shows the daily demand curve for bikes in New York City.Use the green rectangle (triangle symbols) to compute total revenue at various prices along the demand curve.Note: You will not be graded on any changes made to this graph.According to the midpoint method, the price elasticity of demand between points A and B is approximately _______ Suppose the price of bikes is currently $ 200 per bike, shown as point A on the initial graph....
 The following graph shows the daily demand curve for bikes in San Diego.Use the green rectangle (triangle symbols) to compute total revenue at various prices along the demand curve.Note: You will not be graded on any changes made to this graph.According to the midpoint method, the price elasticity of demand between points A and B is approximately _______ Suppose the price of bikes is currently $ 125 per bike, shown as point A on the initial graph. Because the demand between...
 6. Elasticity and total revenue The following graph shows the daily demand curve for bikes in Denver Use the green rectangle (triangle symbols) to compute total revenue at various prices along the demand cur Note: You will not be graded on any changes made to this graph.On the following graph, use the green point (triangle symbol) to plot the annual total revenue when the market price is $50, $75, $100, $125, $150, $175, and $200 per bike. According to the midpoint method, the price...
 6. Elasticity and total revenue The following graph shows the dally demand curve for bikes in New York City. Use the green rectangle (triangle symbols) to compute total revenue at various prices along the demand curve Note: You will not be graded on any changes made to this graph. 300 275 250 225 Total Revenue 175 150 125 100 75 50 03 6912 1518 21 24 27 30 33 36 QUANTITY (Bikes) On the following graph, use the green point...
 The following graph shows the daily demand curve for bikes in New York City. Use the green rectangle (triangle symbols) to compute total revenue at various prices along the demand curve. Note: You will not be graded on any changes made to this graph. ? 300 275 250 Total Revenue 225 200 175 PRICE (Dollars per bike) 150 A 125 B 100 75 50 25 Demand 0 0 3 6 9 27 30 33 36 12 15 18 21 24...
Most questions answered within 3 hours.
-
The following are the Jensen Corporation's unit costs of making
and selling an item at a...
asked 8 minutes ago -
Does direct Medicare reimbursement of Advanced practice nurses
increase access to their services?
asked 55 minutes ago -
List and explain why a company would choose to use a
published
compensation survey vs. creating...
asked 1 hour ago -
A discrete random variable X can take values from 1 to 10. Find
the variance of...
asked 1 hour ago -
The primary financial goal of a corporation is to maximize:
shareholders wealth.
earnings per share.
stock...
asked 1 hour ago -
determine whether the vectors u=(1,2,3,), v=(-2,1,0) and
w=(1,0,1) are linearly dependent or independent.
asked 1 hour ago -
python
Define a function called print_values which takes a dictionary
object as a parameter. The function...
asked 2 hours ago -
In Chapter 1 you created a program named Triangle in
which you displayed a seven-line triangle...
asked 2 hours ago -
Research question: What are the differences between separately
stated and non separately stated transactions in an...
asked 2 hours ago -
By using Arduino write a code that connects two LEDs to two
push-buttons. Each button controls...
asked 3 hours ago -
Bank of America has bonds that pay a coupon interest rate of 5.5
percent and mature...
asked 4 hours ago -
Problem: Patient Fees C++
You are to write a program that computes a patient’s bill for...
asked 6 hours ago