please cleary label answers.The following graph shows the daily demand curve for bikes in Miami....
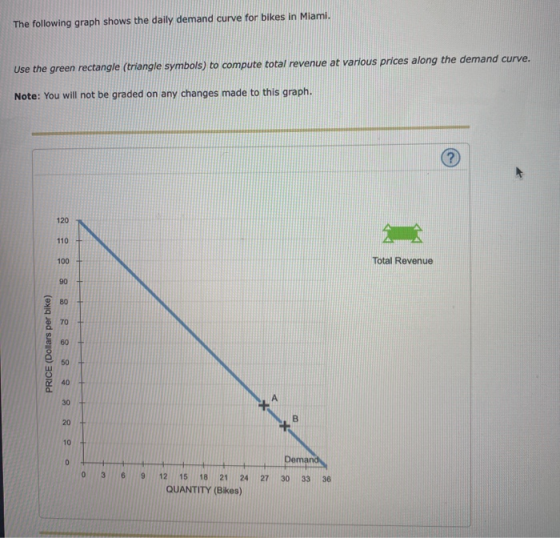
The following graph shows the daily demand curve for bikes in Miami.
Use the green rectangle (triangle symbols) to compute total revenue at various prices along the demand curve.
Note: You will not be graded on any changes made to this graph.


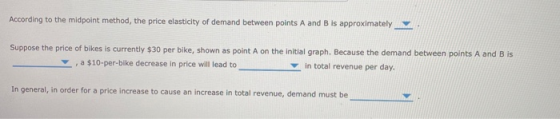
According to the midpoint method, the price elasticity of demand between points A and B is approximately _______
Suppose the price of bikes is currently $ 30 per bike, shown as point A on the initial graph. Because the demand between points A and B is _______
, a $ 10-per-bike decrease in price will lead to _______ in total revenue per day.
In general, in order for a price increase to cause an increase in total revenue, demand must be _______.
Homework Answers
| P | Q | TR |
| 20 | 30 | 600 |
| 30 | 27 | 810 |
| 40 | 24 | 960 |
| 50 | 21 | 1050 |
| 60 | 18 | 1080 |
| 70 | 15 | 1050 |
| 80 | 12 | 960 |

1) Elasticity = [30-27/(30+27/2)]/[20-30/(20+30/2)]
= [3/28.5]/[-10/25] = 0.1053/-0.4 = -0.26
2) Inelastic
3) a decrease
4) inelastic
Add Answer to:
please cleary label answers.The following graph shows the daily demand curve for bikes in Miami....
The following graph shows the daily demand curve for bikes in Detroit.
 6. Elasticity and total revenue The following graph shows the daily demand curve for bikes in Detroit. Use the green rectangle (triangle symbols) to compute total revenue at various prices along the demand curve. Note: You will not be graded on any changes made to this graph. On the following graph, use the green point (triangle symbol) to plot the annual total revenue when the market price is $50, $75, $100, $125, $150, $175, and $200 per bike. According to the midpoint method, the price...
The following graph shows the daily demand curve for bikes in San Francisco.
 6. Elasticity and total revenueThe following graph shows the daily demand curve for bikes in San Francisco.Use the green rectangle (triangle symbols) to compute total revenue at various prices along the demand curve.Note: You will not be graded on any changes made to this graph.On the following graph, use the green point (triangle symbol) to plot the annual total revenue when the market price is $ 50,575, $ 100, $ 125, $ 150, $ 175, and $ 200 per bike.According...
The following graph shows the daily demand curve for bikes in San Diego. Use the green...
 The following graph shows the daily demand curve for bikes in San Diego.Use the green rectangle (triangle symbols) to compute total revenue at various prices along the demand curve.Note: You will not be graded on any changes made to this graph.According to the midpoint method, the price elasticity of demand between points A and B is approximately _______ Suppose the price of bikes is currently $ 125 per bike, shown as point A on the initial graph. Because the demand between...
The following graph shows the daily demand curve for bikes in Detroit.
 The following graph shows the daily demand curve for bikes in Detroit. Use the green rectangle (triangle symbols) to compute total revenue at various prices along the demand curve. Note: You will not be graded on any changes made to this graph.On the following graph, use the green point (triangle symbol) to plot the annual total revenue when the market price is $50, $75, $100, $125, $150, $175, and $200 per bike. According to the midpoint method, the price elasticity of demand between...
6. Elasticity and total revenue The following graph shows the daily demand curve for bikes in...
 6. Elasticity and total revenueThe following graph shows the daily demand curve for bikes in New York City.Use the green rectangle (triangle symbols) to compute total revenue at various prices along the demand curve.Note: You will not be graded on any changes made to this graph.According to the midpoint method, the price elasticity of demand between points A and B is approximately _______ Suppose the price of bikes is currently $ 200 per bike, shown as point A on the initial graph....
6. Elasticity and total revenue The following graph shows the daily demand curve for bikes in...
 6. Elasticity and total revenueThe following graph shows the daily demand curve for bikes in Dallas.Use the green rectangle (triangle symbols) to compute total revenue at various prices along the demand curve.Note: You will not be graded on any changes made to this graph.On the following graph, use the green point (triangle symbol) to plot the annual total revenue when the market price is $ 50, $ 75, $ 100, $ 125, $ 150, $ 175, and $ 200 per...
6. Elasticity and total revenue The following graph shows the daily demand curve for bikes in...
 6. Elasticity and total revenue The following graph shows the daily demand curve for bikes in Denver Use the green rectangle (triangle symbols) to compute total revenue at various prices along the demand cur Note: You will not be graded on any changes made to this graph.On the following graph, use the green point (triangle symbol) to plot the annual total revenue when the market price is $50, $75, $100, $125, $150, $175, and $200 per bike. According to the midpoint method, the price...
5. Elasticity and total revenue The following graph shows the daily demand curve for bikes in Miami. Use the green rectangle (triangle symbols) to compute total revenue at various prices along the demand curve. Note: You will not be graded on any changes
 5. Elasticity and total revenueThe following graph shows the daily demand curve for bikes in Miami.Use the green rectangle (triangle symbols) to compute total revenue at various prices along the demand curve.Note: You will not be graded on any changes made to this graph.On the following graph, use the green point (triangle symbol) to plot the annual total revenue when the market price is $50, $75, $100, $125, $150, $175, and $200 per bike. According to the midpoint method, the price...
6. Elasticity and total revenue The following graph shows the dally demand curve for bikes in...
 6. Elasticity and total revenue The following graph shows the dally demand curve for bikes in New York City. Use the green rectangle (triangle symbols) to compute total revenue at various prices along the demand curve Note: You will not be graded on any changes made to this graph. 300 275 250 225 Total Revenue 175 150 125 100 75 50 03 6912 1518 21 24 27 30 33 36 QUANTITY (Bikes) On the following graph, use the green point...
The following graph shows the daily demand curve for bikes in New York City. Use the...
 The following graph shows the daily demand curve for bikes in New York City. Use the green rectangle (triangle symbols) to compute total revenue at various prices along the demand curve. Note: You will not be graded on any changes made to this graph. ? 300 275 250 Total Revenue 225 200 175 PRICE (Dollars per bike) 150 A 125 B 100 75 50 25 Demand 0 0 3 6 9 27 30 33 36 12 15 18 21 24...
 The following graph shows the daily demand curve for bikes in San Diego.Use the green rectangle (triangle symbols) to compute total revenue at various prices along the demand curve.Note: You will not be graded on any changes made to this graph.According to the midpoint method, the price elasticity of demand between points A and B is approximately _______ Suppose the price of bikes is currently $ 125 per bike, shown as point A on the initial graph. Because the demand between...
 6. Elasticity and total revenue The following graph shows the daily demand curve for bikes in Denver Use the green rectangle (triangle symbols) to compute total revenue at various prices along the demand cur Note: You will not be graded on any changes made to this graph.On the following graph, use the green point (triangle symbol) to plot the annual total revenue when the market price is $50, $75, $100, $125, $150, $175, and $200 per bike. According to the midpoint method, the price...
 6. Elasticity and total revenue The following graph shows the dally demand curve for bikes in New York City. Use the green rectangle (triangle symbols) to compute total revenue at various prices along the demand curve Note: You will not be graded on any changes made to this graph. 300 275 250 225 Total Revenue 175 150 125 100 75 50 03 6912 1518 21 24 27 30 33 36 QUANTITY (Bikes) On the following graph, use the green point...
 The following graph shows the daily demand curve for bikes in New York City. Use the green rectangle (triangle symbols) to compute total revenue at various prices along the demand curve. Note: You will not be graded on any changes made to this graph. ? 300 275 250 Total Revenue 225 200 175 PRICE (Dollars per bike) 150 A 125 B 100 75 50 25 Demand 0 0 3 6 9 27 30 33 36 12 15 18 21 24...
Most questions answered within 3 hours.
-
Please answer true or false. Words
cannot be changed or added in to make it true...
asked 51 minutes ago -
An empty test tube weighs 15.923 grams. Then,
MgCl2•6H2O is added into the test tube. After...
asked 52 minutes ago -
(a) A piston at 6.1 atm contains a gas that occupies a volume of
3.5 L....
asked 52 minutes ago -
Assume memory access is 10 units of time and disk access is
10000 units of time....
asked 1 hour ago -
1. Are all good samples random?
2. Magazines often report surveys giving statistics such as “63%...
asked 1 hour ago -
Under all the various types of market structures, firms
must eventually earn some economic profits for...
asked 1 hour ago -
Consider the following fitness regime for a single locus trait
with two co-dominant alleles: w11 =...
asked 1 hour ago -
A large cable company reports the following.
80% of its customers subscribe to its cable TV...
asked 1 hour ago -
Please answer the question in brief.
Discuss the role of ERP in organizations. Are ERP tools...
asked 1 hour ago -
Discuss the pros and cons of collaborative software such
as SameTime. Does it increase productivity? What...
asked 1 hour ago -
Buying your in-laws a gift because it’s expected is
due to the ____________ motive of gift-giving....
asked 1 hour ago -
Calculate the expected value, the variance, and the standard
deviation of the given random variable X....
asked 2 hours ago