


Homework Answers


Add Answer to:
Compute and Interpret Liquidity, Solvency and Coverage Ratios Balance sheets and income statements for Lockheed Martin...
Compute and interpret Liquidity, Solvency and Coverage Ratios Balance sheets and income statements for Lockheed Martin...
 Compute and interpret Liquidity, Solvency and Coverage Ratios Balance sheets and income statements for Lockheed Martin Corporation follow. Refer to these financial statements to answer the requirements. Income Statement Year Ended December 31 (In millions) 2005 2004 2003 Net sales Products $31,518 $30,202 $ 27,290 Service 5,695 5,324 4534 37,213 35,526 31,824 Cost of sales Products 27,882 27,637 25,306 Service 5,073 4,765 4,099 Unallocated coporate costs 803 914 443 33,758 33,316 29,848 3,455 2,210 1,976 Other income expenses, net (449)...
Compute and Interpret Liquidity, Solvency and Coverage Ratios Balance sheets and income statements for Lockheed Martin...
 Compute and Interpret Liquidity, Solvency and Coverage Ratios Balance sheets and income statements for Lockheed Martin Corporation follow. Refer to these financial statements to answer the requirements. Income Statement Year Ended December 31 (In millions) 2005 2004 2003 Net sales Products $31,518 $30,202 $ 27.290 Service 5,695 5,324 4,534 37,213 35,526 31,824 Cost of sales Products 27,892 27,667 25,306 Service 5,073 4,765 4,099 Unallocated coporate costs 803 914 443 33,768 33,346 29,848 3,445 2,180 1,976 Other income (expenses), net (449)...
Compute and Interpret Liquidity, Solvency and Coverage Ratios Balance sheets and income statements for Lockheed Martin...
Compute and Interpret Liquidity, Solvency and Coverage Ratios Balance sheets and income statements for Lockheed Martin Corporation follow. Refer to these financial statements to answer the requirements. Income Statement Year Ended December 31 (In millions) 2005 2004 2003 Net sales Products $ 31,518 $ 30,202 $ 27,290 Service 5,695 5,324 4,534 37,213 35,526 31,824 Cost of sales Products 28,800 27,879 25,306 Service 5,073 4,765 4,099 Unallocated coporate costs 803 914 443 34,676 33,558 29,848 2,537 1,968 1,976 Other income (expenses),...
Compute and Interpret Liquidity, Solvency and Coverage Ratios Balance sheets and income statements for Lockheed Martin...
 Compute and Interpret Liquidity, Solvency and Coverage Ratios Balance sheets and income statements for Lockheed Martin Corporation follow. Refer to these financial statements to answer the requirements. Income Statement Year Ended December 31 (In millions) 2005 2004 2003 Net sales Products $ 31,518 $ 30,202 $ 27,290 Service 5,695 5,324 4,534 37,213 35,526 31,824 Cost of sales Products 27,892 27,667 25,306 Service 5,073 4,765 4,099 Unallocated coporate costs 803 914 443 33.768 33,346 29,848 3,445 2,180 1.976 Other income (expenses),...
p Compute and interpret Liquidity. Solvency and Coverage Ratios Balance sheets and income statements for Lockheed...
 p
Compute and interpret Liquidity. Solvency and Coverage Ratios Balance sheets and income statements for Lockheed Martin Corporation follow. Refer to these financial statements to answer the requirements. Income Statement Year Ended December 31 (in millions) 2005 2004 2003 Net sales Products $ 31,518 $ 30,202 $ 27.290 Service 5,695 5:324 4,534 37 213 35 526 31 824 Cost of sales Products 27,892 27,667 25,306 Service 5073 4,765 4,099 Unallocated coporate costs Воз 914 443 33,768 33,345 29,848 3.445 2,180...
p
Compute and interpret Liquidity. Solvency and Coverage Ratios Balance sheets and income statements for Lockheed Martin Corporation follow. Refer to these financial statements to answer the requirements. Income Statement Year Ended December 31 (in millions) 2005 2004 2003 Net sales Products $ 31,518 $ 30,202 $ 27.290 Service 5,695 5:324 4,534 37 213 35 526 31 824 Cost of sales Products 27,892 27,667 25,306 Service 5073 4,765 4,099 Unallocated coporate costs Воз 914 443 33,768 33,345 29,848 3.445 2,180...
a. compute quick ratio b. total debt-to-equity Compute and interpret Liquidity, Solvency and Coverage Ratios Balance...
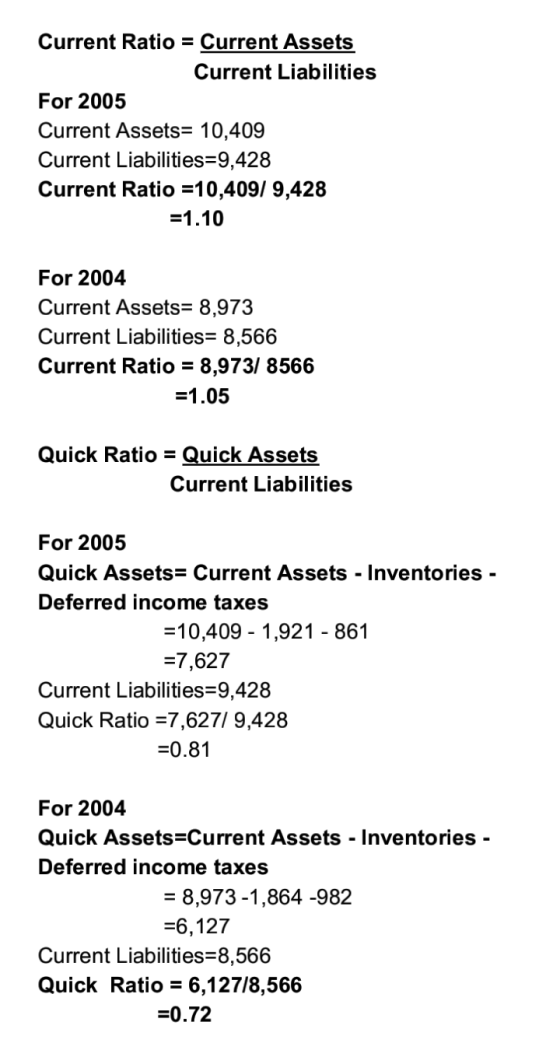
 a. compute quick ratio
b. total debt-to-equity
Compute and interpret Liquidity, Solvency and Coverage Ratios Balance sheets and income statements for Lockheed Martin Corporation follow. Refer to these financial statements to answer the requirements. Income Statement Year Ended December 31 (In millions) 2005 2004 2003 Net sales Products $ 31,518 $30,202 $ 27,290 Service 5,695 5,324 4,534 37,213 35,526 31,824 Cost of sales Products 27,932 27,637 25,306 Service 5,073 4,765 4,099 Unallocated coporate costs 803 914 443 33,808 33,316 29,848...
a. compute quick ratio
b. total debt-to-equity
Compute and interpret Liquidity, Solvency and Coverage Ratios Balance sheets and income statements for Lockheed Martin Corporation follow. Refer to these financial statements to answer the requirements. Income Statement Year Ended December 31 (In millions) 2005 2004 2003 Net sales Products $ 31,518 $30,202 $ 27,290 Service 5,695 5,324 4,534 37,213 35,526 31,824 Cost of sales Products 27,932 27,637 25,306 Service 5,073 4,765 4,099 Unallocated coporate costs 803 914 443 33,808 33,316 29,848...
Compute and Interpret Liquidity, Solvency and Coverage Ratios Balance sheets and income statements for Lockheed Martin...
 Compute and Interpret Liquidity, Solvency and Coverage Ratios Balance sheets and income statements for Lockheed Martin Corporation follow. Refer to these financial statements to answer the requirements. Consolidated Statements of Earnings Year Ended December 31 (In millions) 2016 2015 Net sales Products $ 40,365 $ 34,868 Services 6,883 5,668 Total net sales 47,248 40,536 Cost of sales Products (36,616) (31,091) Services (6,040) (4,824) Severance and other charges (80) (82) Other unallocated costs 550 (47) Total cost of sales (42,186) (36,044)...
Compute and Interpret Liquidity, Solvency and Coverage Ratios Balance sheets and income statements for Lockheed Martin...
Compute and Interpret Liquidity, Solvency and Coverage Ratios Balance sheets and income statements for Lockheed Martin Corporation follow. Refer to these financial statements to answer the requirements. Consolidated Statements of Earnings Year Ended December 31 (In millions) 2016 2015 Net sales Products $ 40,365 $ 34,868 Services 6,883 5,668 Total net sales 47,248 40,536 Cost of sales Products (36,616) (31,091) Services (6,040) (4,824) Severance and other charges (80) (82) Other unallocated costs 550 (47) Total cost of sales (42,186) (36,044)...
Compute and Interpret Liquidity, Solvency and Coverage Ratios Information from the balance sheet, income statement, and...
 Compute and Interpret Liquidity, Solvency and Coverage Ratios Information from the balance sheet, income statement, and statement of cash flows for Nike follows. Refer to these financial statements to answer the requirements. NIKE, INC. Consolidated Statements of Income Year Ended December 31 (In millions) 2019 2018 Revenues $39,117 $36,397 Cost of sales 21,643 20,441 Gross profit 17,474 15,956 Demand creation expense 3,753 3,577 Operating overhead expense 8,949 7,934 Total selling and administrative expense 12,702 11,511 Interest expense (income), net 49...
Compute and Interpret Liquidity, Solvency and Coverage Ratios Selected balance sheet and income statement information for...
Compute and Interpret Liquidity, Solvency and Coverage Ratios Selected balance sheet and income statement information for Calpine Corporation for 2004 and 2006 follows. ($ millions) 2004 2006 Cash $ 1,256.73 $ 1,523.36 Accounts receivable 1,097.16 735.30 Current assets 3,313.56 3,268.33 Current liabilities 3,285.39 6,057.95 Long-term debt 17,150.81 3,531.63 Short-term debt 1,033.96 4,568.83 Total liabilities 22,898.42 25,503.17 Interest expense 1,516.90 1,288.29 Capital expenditures 1,545.48 211.50 Equity 4,587.67 (7,152.90) Cash from operations 19.89 335.98 Earnings before interest and taxes 1,659.84 1,907.84 (a)...
 Compute and interpret Liquidity, Solvency and Coverage Ratios Balance sheets and income statements for Lockheed Martin Corporation follow. Refer to these financial statements to answer the requirements. Income Statement Year Ended December 31 (In millions) 2005 2004 2003 Net sales Products $31,518 $30,202 $ 27,290 Service 5,695 5,324 4534 37,213 35,526 31,824 Cost of sales Products 27,882 27,637 25,306 Service 5,073 4,765 4,099 Unallocated coporate costs 803 914 443 33,758 33,316 29,848 3,455 2,210 1,976 Other income expenses, net (449)...
 Compute and Interpret Liquidity, Solvency and Coverage Ratios Balance sheets and income statements for Lockheed Martin Corporation follow. Refer to these financial statements to answer the requirements. Income Statement Year Ended December 31 (In millions) 2005 2004 2003 Net sales Products $31,518 $30,202 $ 27.290 Service 5,695 5,324 4,534 37,213 35,526 31,824 Cost of sales Products 27,892 27,667 25,306 Service 5,073 4,765 4,099 Unallocated coporate costs 803 914 443 33,768 33,346 29,848 3,445 2,180 1,976 Other income (expenses), net (449)...
 Compute and Interpret Liquidity, Solvency and Coverage Ratios Balance sheets and income statements for Lockheed Martin Corporation follow. Refer to these financial statements to answer the requirements. Income Statement Year Ended December 31 (In millions) 2005 2004 2003 Net sales Products $ 31,518 $ 30,202 $ 27,290 Service 5,695 5,324 4,534 37,213 35,526 31,824 Cost of sales Products 27,892 27,667 25,306 Service 5,073 4,765 4,099 Unallocated coporate costs 803 914 443 33.768 33,346 29,848 3,445 2,180 1.976 Other income (expenses),...
 p
Compute and interpret Liquidity. Solvency and Coverage Ratios Balance sheets and income statements for Lockheed Martin Corporation follow. Refer to these financial statements to answer the requirements. Income Statement Year Ended December 31 (in millions) 2005 2004 2003 Net sales Products $ 31,518 $ 30,202 $ 27.290 Service 5,695 5:324 4,534 37 213 35 526 31 824 Cost of sales Products 27,892 27,667 25,306 Service 5073 4,765 4,099 Unallocated coporate costs Воз 914 443 33,768 33,345 29,848 3.445 2,180...
p
Compute and interpret Liquidity. Solvency and Coverage Ratios Balance sheets and income statements for Lockheed Martin Corporation follow. Refer to these financial statements to answer the requirements. Income Statement Year Ended December 31 (in millions) 2005 2004 2003 Net sales Products $ 31,518 $ 30,202 $ 27.290 Service 5,695 5:324 4,534 37 213 35 526 31 824 Cost of sales Products 27,892 27,667 25,306 Service 5073 4,765 4,099 Unallocated coporate costs Воз 914 443 33,768 33,345 29,848 3.445 2,180...
 a. compute quick ratio
b. total debt-to-equity
Compute and interpret Liquidity, Solvency and Coverage Ratios Balance sheets and income statements for Lockheed Martin Corporation follow. Refer to these financial statements to answer the requirements. Income Statement Year Ended December 31 (In millions) 2005 2004 2003 Net sales Products $ 31,518 $30,202 $ 27,290 Service 5,695 5,324 4,534 37,213 35,526 31,824 Cost of sales Products 27,932 27,637 25,306 Service 5,073 4,765 4,099 Unallocated coporate costs 803 914 443 33,808 33,316 29,848...
a. compute quick ratio
b. total debt-to-equity
Compute and interpret Liquidity, Solvency and Coverage Ratios Balance sheets and income statements for Lockheed Martin Corporation follow. Refer to these financial statements to answer the requirements. Income Statement Year Ended December 31 (In millions) 2005 2004 2003 Net sales Products $ 31,518 $30,202 $ 27,290 Service 5,695 5,324 4,534 37,213 35,526 31,824 Cost of sales Products 27,932 27,637 25,306 Service 5,073 4,765 4,099 Unallocated coporate costs 803 914 443 33,808 33,316 29,848...
 Compute and Interpret Liquidity, Solvency and Coverage Ratios Balance sheets and income statements for Lockheed Martin Corporation follow. Refer to these financial statements to answer the requirements. Consolidated Statements of Earnings Year Ended December 31 (In millions) 2016 2015 Net sales Products $ 40,365 $ 34,868 Services 6,883 5,668 Total net sales 47,248 40,536 Cost of sales Products (36,616) (31,091) Services (6,040) (4,824) Severance and other charges (80) (82) Other unallocated costs 550 (47) Total cost of sales (42,186) (36,044)...
 Compute and Interpret Liquidity, Solvency and Coverage Ratios Information from the balance sheet, income statement, and statement of cash flows for Nike follows. Refer to these financial statements to answer the requirements. NIKE, INC. Consolidated Statements of Income Year Ended December 31 (In millions) 2019 2018 Revenues $39,117 $36,397 Cost of sales 21,643 20,441 Gross profit 17,474 15,956 Demand creation expense 3,753 3,577 Operating overhead expense 8,949 7,934 Total selling and administrative expense 12,702 11,511 Interest expense (income), net 49...
Most questions answered within 3 hours.
-
1a) According to the ideal gas law, _______________.
a. a gas has infinite volume at absolute...
asked 58 minutes ago -
Oakdale Fashions, Inc. had $245,000 in 2018 taxable income.
Using the tax schedule in Table 2.3...
asked 1 hour ago -
The marketing class at CSUS had an average score of 150. An
educational analyst determined that...
asked 2 hours ago -
Justin Case has purchased a $250 000 home by putting 20 % down
and taking out...
asked 2 hours ago -
1. In a labor market, marginal cost for a firm is
____________.
a. recruiting cost
b....
asked 3 hours ago -
On January 1, 2019, ABC Company issued $60,000,000 of 20-year,
10.5% bonds when the market rate...
asked 3 hours ago -
39.4% of US homes continue to use a landline in addition to cell
phone service. 3...
asked 4 hours ago -
Starting with benzene, synthesize 1-phenyl-1-butyne.
Show intermediates and reagents.
asked 5 hours ago -
Create a 32-run crossed array design with six control factors
and two noise factors such that...
asked 6 hours ago -
A 500g sample of sand from source A has the following amounts
retained on each sieve....
asked 6 hours ago -
In
your own words, please explain the essay by John Keynes wrote "The
End of Laissez...
asked 6 hours ago -
How are the matrix and pixels related? Why are smaller
pixels better for diagnostic quality?
asked 6 hours ago