
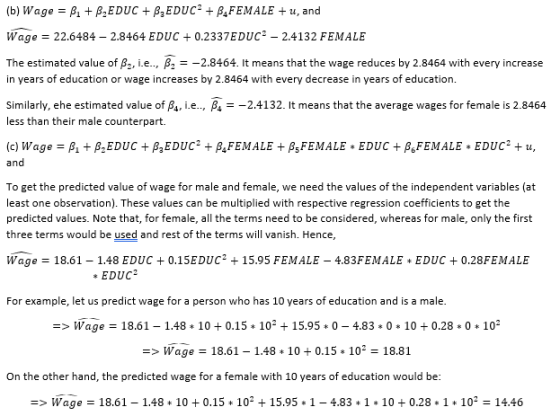
please help,it is a revision question for my exam tomorrow and i am stuck
Homework Answers
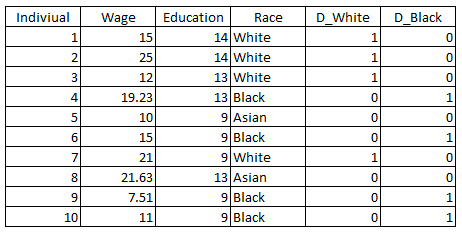
(a) Since there are 3 types of race, we can use 2 dummy variables in the presence of the intercept in the model. The variables created in the table are D_White, which takes a value 1 if the individual is white, else 0. Similarly, the dummy variable D_Black takes a value 1 if an individual is black, else 0. The variables have been shown in the table below. For example, individual 5 is an Asian (i.e., neither white, nor black). Hence, both the dummy variables created have a value 0 for this individual.
Add Answer to:
please help,it is a revision question for my exam
tomorrow and i am stuck
Question Four...
Could I please get an answer to this problem? Thank you. 4. Consider the following regression...
 Could I please get an answer to this problem? Thank
you.
4. Consider the following regression model of log(rage) log(wage)-As + &female + βί educ + u, where wage is hourly wage, female is a dummy variable indicating gender (1 for women and 0 for men), and educ is the number of years of education. Augment the model to allow the return to education to differ by gender
Could I please get an answer to this problem? Thank
you.
4. Consider the following regression model of log(rage) log(wage)-As + &female + βί educ + u, where wage is hourly wage, female is a dummy variable indicating gender (1 for women and 0 for men), and educ is the number of years of education. Augment the model to allow the return to education to differ by gender
Please help with 4. a) b) c)
1. Use the LNU dataset that allows you to estimate a wage equation. Estimate a wage equation including a dummy variable for female (FEMALE). Interpret the estimated coefficient for the variable Female. 2. Estimate the same model adding a dummy variable for public sector (PUBLIC). Interpret the estimated coefficient for the variable PUBLIC. Compare the estimate for FEMALE in this model and the model above where the variable PUBLIC was not included.3. Estimate the wage equations above separately for Men and...
hi can someone answer part e) f) g) h) with workings olease thanks 2) A cross-sectional study suggests the following wage equation: In(wage,)-α + βι EDUC' + β:FEMALE + β3EXPER, + β4FEMALE EXP...
 hi can someone answer part e) f) g) h) with workings olease
thanks
2) A cross-sectional study suggests the following wage equation: In(wage,)-α + βι EDUC' + β:FEMALE + β3EXPER, + β4FEMALE EXPERi + ei Where: In(wage): Natural logarithm of f hourly wage; EDUC: Years of education; EXPER: Years of work experience; FEMALE: Dummy which equals 1 if the respondent is female and 0 otherwise; FEMALE EXPER:Interaction between FEMALE, and EXPER a) What is meant by the population level regression...
hi can someone answer part e) f) g) h) with workings olease
thanks
2) A cross-sectional study suggests the following wage equation: In(wage,)-α + βι EDUC' + β:FEMALE + β3EXPER, + β4FEMALE EXPERi + ei Where: In(wage): Natural logarithm of f hourly wage; EDUC: Years of education; EXPER: Years of work experience; FEMALE: Dummy which equals 1 if the respondent is female and 0 otherwise; FEMALE EXPER:Interaction between FEMALE, and EXPER a) What is meant by the population level regression...
QUESTION 1 Consider the following OLS regression line (or sample regression function): wage =-2.10+ 0.50 educ...
 QUESTION 1 Consider the following OLS regression line (or sample regression function): wage =-2.10+ 0.50 educ (1), where wage is hourly wage, measured in dollars, and educ years of formal education. According to (1), a person with no education has a predicted hourly wage of [wagehat] dollars. (NOTE: Write your answer in number format, with 2 decimal places of precision level; do not write your answer as a fraction. Add a leading minus sign symbol, a leading zero and trailing...
The information of data 1 Question Consider the following table that relates earning per hour (WAGE)...
 The information of data 1
Question
Consider the following table that relates earning per hour (WAGE) to years of education (EDUC): Dependent Variable: WAGE Method Least Squares Date: 03/09/20 Time 1330 Sample: 11200 Included observations: 1200 Variable Coefficient Std. Error -Statistic tbl) 1770148 Prob. 0.0000 0.0000 1962400 se(b2) EDUC - 10 39996 2 396761 R-squared Adjusted R-squared SE of regression Sum squared resid Log likelihood F-statistic Prob(F statistic) 0 207327 Mean dependent var 0 206666 SD dependent var 13.55328 Akake...
The information of data 1
Question
Consider the following table that relates earning per hour (WAGE) to years of education (EDUC): Dependent Variable: WAGE Method Least Squares Date: 03/09/20 Time 1330 Sample: 11200 Included observations: 1200 Variable Coefficient Std. Error -Statistic tbl) 1770148 Prob. 0.0000 0.0000 1962400 se(b2) EDUC - 10 39996 2 396761 R-squared Adjusted R-squared SE of regression Sum squared resid Log likelihood F-statistic Prob(F statistic) 0 207327 Mean dependent var 0 206666 SD dependent var 13.55328 Akake...
asap i beg u IL. (15pts) You are given the following three estimated models, with all the variables described as in question II Dependent variable: log (wage) educ 0.056** 0.062* 0.049* 0.022) (0....
 asap i beg u
IL. (15pts) You are given the following three estimated models, with all the variables described as in question II Dependent variable: log (wage) educ 0.056** 0.062* 0.049* 0.022) (0.006) (0.022) feduc 0.027 C0.027) 0.021 0.028) married 1.000 0.606 (0.518) (0.466) age 0.032 C0.114) (0.103) (0.116) 0.034 feduc. educ -0.001 (0.002) -0.0003 (0.002) married.age 0.037 0.025 C0.016) (0.014) 0.001 0.001 -0.00000 C0.002) C0.002) C0.002) agesq Constant 5.306**5.218* 5.090*** (1.923) C1.723) C1.932) observations 741 R2 741 0.151 741...
asap i beg u
IL. (15pts) You are given the following three estimated models, with all the variables described as in question II Dependent variable: log (wage) educ 0.056** 0.062* 0.049* 0.022) (0.006) (0.022) feduc 0.027 C0.027) 0.021 0.028) married 1.000 0.606 (0.518) (0.466) age 0.032 C0.114) (0.103) (0.116) 0.034 feduc. educ -0.001 (0.002) -0.0003 (0.002) married.age 0.037 0.025 C0.016) (0.014) 0.001 0.001 -0.00000 C0.002) C0.002) C0.002) agesq Constant 5.306**5.218* 5.090*** (1.923) C1.723) C1.932) observations 741 R2 741 0.151 741...
An over-the-counter drug manufacturer wants to examine the effectiveness of a new drug in curing an illness most commonly found in older patients. Thirteen patients are given the new drug and 13 patie...
An over-the-counter drug manufacturer wants to examine the effectiveness of a new drug in curing an illness most commonly found in older patients. Thirteen patients are given the new drug and 13 patients are given the old drug. To avoid bias in the experiment, they are not told which drug is given to them. To check how the effectiveness depends on the age of patients, the following data have been collected. To examine the differences between salaries of male and...
1. Which of the following conditions will lead to a smaller variance for the intercept estimator...
1. Which of the following conditions will lead to a smaller variance for the intercept estimator for your multiple regression model? (A) X values cluster far from the origin of the X axis (B) X values closely pack around the mean of X in your sample (C) Small sample sizes (D) High correlation among the explanatory variables (E) Small error variance in the population regression function 2. R-squared (A) measures the proportion of variability of the dependent variable that is...
Q2) Independent-Samples t-Test (15 points total) Help with H, I, J, K, L please! In a...
Q2) Independent-Samples t-Test (15 points total) Help with H, I, J, K, L please! In a research project, researchers collected demographic and health data from a sample of elderly residents in the community. To examine any possible gender differences in their sample, they want to see if the females and the males differ significantly on the education level (number of years of formal schooling). The researchers are not predicting any direction in the possible gender differences so the hypotheses should...
i need help to understand those two question from discussion in this artical please. 3. Take...
 i need help to understand those two question from discussion
in this artical please.
3. Take a few minutes to re-read the first four paragraphs of the Discussion section. Explain in your own words the "metabolic suppression hypothesis" proposed by the researchers: what is the hypothesis, and why might it be plausible? WRITE YOUR RESPONSE HERE PLEASE (don't forget the in-text citation, as well as quotation marks and a page number if you are quoting in your answer) This study...
i need help to understand those two question from discussion
in this artical please.
3. Take a few minutes to re-read the first four paragraphs of the Discussion section. Explain in your own words the "metabolic suppression hypothesis" proposed by the researchers: what is the hypothesis, and why might it be plausible? WRITE YOUR RESPONSE HERE PLEASE (don't forget the in-text citation, as well as quotation marks and a page number if you are quoting in your answer) This study...
 Could I please get an answer to this problem? Thank
you.
4. Consider the following regression model of log(rage) log(wage)-As + &female + βί educ + u, where wage is hourly wage, female is a dummy variable indicating gender (1 for women and 0 for men), and educ is the number of years of education. Augment the model to allow the return to education to differ by gender
Could I please get an answer to this problem? Thank
you.
4. Consider the following regression model of log(rage) log(wage)-As + &female + βί educ + u, where wage is hourly wage, female is a dummy variable indicating gender (1 for women and 0 for men), and educ is the number of years of education. Augment the model to allow the return to education to differ by gender
 hi can someone answer part e) f) g) h) with workings olease
thanks
2) A cross-sectional study suggests the following wage equation: In(wage,)-α + βι EDUC' + β:FEMALE + β3EXPER, + β4FEMALE EXPERi + ei Where: In(wage): Natural logarithm of f hourly wage; EDUC: Years of education; EXPER: Years of work experience; FEMALE: Dummy which equals 1 if the respondent is female and 0 otherwise; FEMALE EXPER:Interaction between FEMALE, and EXPER a) What is meant by the population level regression...
hi can someone answer part e) f) g) h) with workings olease
thanks
2) A cross-sectional study suggests the following wage equation: In(wage,)-α + βι EDUC' + β:FEMALE + β3EXPER, + β4FEMALE EXPERi + ei Where: In(wage): Natural logarithm of f hourly wage; EDUC: Years of education; EXPER: Years of work experience; FEMALE: Dummy which equals 1 if the respondent is female and 0 otherwise; FEMALE EXPER:Interaction between FEMALE, and EXPER a) What is meant by the population level regression...
 QUESTION 1 Consider the following OLS regression line (or sample regression function): wage =-2.10+ 0.50 educ (1), where wage is hourly wage, measured in dollars, and educ years of formal education. According to (1), a person with no education has a predicted hourly wage of [wagehat] dollars. (NOTE: Write your answer in number format, with 2 decimal places of precision level; do not write your answer as a fraction. Add a leading minus sign symbol, a leading zero and trailing...
 The information of data 1
Question
Consider the following table that relates earning per hour (WAGE) to years of education (EDUC): Dependent Variable: WAGE Method Least Squares Date: 03/09/20 Time 1330 Sample: 11200 Included observations: 1200 Variable Coefficient Std. Error -Statistic tbl) 1770148 Prob. 0.0000 0.0000 1962400 se(b2) EDUC - 10 39996 2 396761 R-squared Adjusted R-squared SE of regression Sum squared resid Log likelihood F-statistic Prob(F statistic) 0 207327 Mean dependent var 0 206666 SD dependent var 13.55328 Akake...
The information of data 1
Question
Consider the following table that relates earning per hour (WAGE) to years of education (EDUC): Dependent Variable: WAGE Method Least Squares Date: 03/09/20 Time 1330 Sample: 11200 Included observations: 1200 Variable Coefficient Std. Error -Statistic tbl) 1770148 Prob. 0.0000 0.0000 1962400 se(b2) EDUC - 10 39996 2 396761 R-squared Adjusted R-squared SE of regression Sum squared resid Log likelihood F-statistic Prob(F statistic) 0 207327 Mean dependent var 0 206666 SD dependent var 13.55328 Akake...
 asap i beg u
IL. (15pts) You are given the following three estimated models, with all the variables described as in question II Dependent variable: log (wage) educ 0.056** 0.062* 0.049* 0.022) (0.006) (0.022) feduc 0.027 C0.027) 0.021 0.028) married 1.000 0.606 (0.518) (0.466) age 0.032 C0.114) (0.103) (0.116) 0.034 feduc. educ -0.001 (0.002) -0.0003 (0.002) married.age 0.037 0.025 C0.016) (0.014) 0.001 0.001 -0.00000 C0.002) C0.002) C0.002) agesq Constant 5.306**5.218* 5.090*** (1.923) C1.723) C1.932) observations 741 R2 741 0.151 741...
asap i beg u
IL. (15pts) You are given the following three estimated models, with all the variables described as in question II Dependent variable: log (wage) educ 0.056** 0.062* 0.049* 0.022) (0.006) (0.022) feduc 0.027 C0.027) 0.021 0.028) married 1.000 0.606 (0.518) (0.466) age 0.032 C0.114) (0.103) (0.116) 0.034 feduc. educ -0.001 (0.002) -0.0003 (0.002) married.age 0.037 0.025 C0.016) (0.014) 0.001 0.001 -0.00000 C0.002) C0.002) C0.002) agesq Constant 5.306**5.218* 5.090*** (1.923) C1.723) C1.932) observations 741 R2 741 0.151 741...
 i need help to understand those two question from discussion
in this artical please.
3. Take a few minutes to re-read the first four paragraphs of the Discussion section. Explain in your own words the "metabolic suppression hypothesis" proposed by the researchers: what is the hypothesis, and why might it be plausible? WRITE YOUR RESPONSE HERE PLEASE (don't forget the in-text citation, as well as quotation marks and a page number if you are quoting in your answer) This study...
i need help to understand those two question from discussion
in this artical please.
3. Take a few minutes to re-read the first four paragraphs of the Discussion section. Explain in your own words the "metabolic suppression hypothesis" proposed by the researchers: what is the hypothesis, and why might it be plausible? WRITE YOUR RESPONSE HERE PLEASE (don't forget the in-text citation, as well as quotation marks and a page number if you are quoting in your answer) This study...
Most questions answered within 3 hours.
-
1. When a nearsighted person looks at an object that is in the
distance with their...
asked 1 minute from now -
QUESTION 8
Both of these statements will store the same value in the
variable $number
$number...
asked 23 minutes ago -
The price of 1 lb of potatoes is $1.75. If all the potatoes sold
today at...
asked 1 hour ago -
Garcia Company issues 20.00%, 15-year bonds with a par value of
$470,000 and semiannual interest payments....
asked 1 hour ago -
In C++ Programming, Try using loops only.
This lab demonstrates the use of the While Loop...
asked 2 hours ago -
Effect of DCMU and sodium azide on Chlamydomonas? We did an
experiment where we had Chlamydomonas...
asked 2 hours ago -
1a) According to the ideal gas law, _______________.
a. a gas has infinite volume at absolute...
asked 4 hours ago -
Oakdale Fashions, Inc. had $245,000 in 2018 taxable income.
Using the tax schedule in Table 2.3...
asked 4 hours ago -
The marketing class at CSUS had an average score of 150. An
educational analyst determined that...
asked 5 hours ago -
Justin Case has purchased a $250 000 home by putting 20 % down
and taking out...
asked 6 hours ago -
1. In a labor market, marginal cost for a firm is
____________.
a. recruiting cost
b....
asked 6 hours ago -
On January 1, 2019, ABC Company issued $60,000,000 of 20-year,
10.5% bonds when the market rate...
asked 7 hours ago