

Homework Answers
a. original equilibrium: 200-P=P-20 or 2P=220 hence P=110 and Q=90
equilibrium after the innovation:
supply curve equation, for each P will go down by 20 for each Q
hence Q=(P+20)-20 or P=Q
now equilibrium will be, P=200-P hence P=100 and Q=100
Now writing down the
Demand curve: Q=200-P or P=200-Q , when P=0, Q=200 When Q=0, P=200
Supply curve: old: Q=P-20 or P=Q+20 when Q=0,P=20
Supply curve : new: P=Q when P=0,Q=0
 THE RED ARE DEPICTS NEW
CONSUMER SURPLUS
THE RED ARE DEPICTS NEW
CONSUMER SURPLUS
THE GREEN AREA DEPICT NEW PRODUCERS SURPLUS .
THE VALUE OF NEW CONSUMER SURPLUS= 0.5(200-100)X100=5000
THE VALUE OF NEW PRODUCER SURPLUS=0.5(100-100)100=5000
BOTH PRODUCERS AND CONSUMERS BENEFITTED.
WHY?
BECAUSE CONSUMER ARE GETTING MORE AT LESSER PRICE.
PRODUCERS ARE PRODUCING MORE AND THEIR PROFIT ALSO INCREASING(PRICE DECREASED 10 BUT THEIR COST HAD GONE DOWN BY 20)
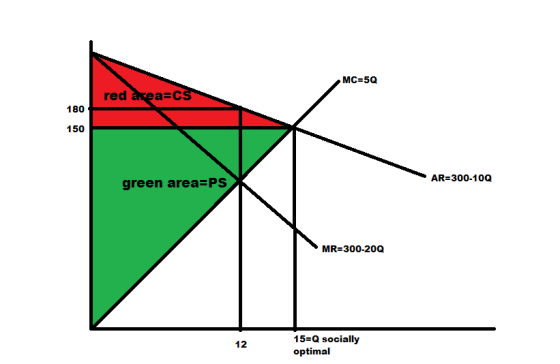
4 SOLUTION:
GIVEN DEMAND, Q=30-0.1P OR P=300-10Q
OR TOTAL REVENUE, PQ=300Q-10Q^2
MARGINAL REVENUE,MR= d/dQ(300Q-10Q^2)=300-20Q
GIVEN MC=5Q
HENCE, EQUILIBIRUM AT MC=MR OR 5Q=300-20Q OR Q=300/25=12 AND P=300-120=180
BUT SOCIALLY OPTIMAL OUTPUT, MC=P OR 300-10Q=5Q OR Q*=15 AND P*=150

in social optimal condition, the price equals MC. that means at that level producers can produce at a level where they just get back the cost they incur while producing the last unit. on the other hand, the consumers get the price at less price.
in social optimal level, there is no deadweight loss. as shown in the diagram:
I hope you liked the answer. give a thumbs up if it helped you.
comment down if you have any doubt
Add Answer to:
Question 2 (15 points) Continuing your analysis of the competitive US manufacturing industry from Question 1,...
Imagine that you have been given a job as an economic advisor to evaluate a certain...
Imagine that you have been given a job as an economic advisor to evaluate a certain competitive US manufacturing industry. Your (accurate) statistical analysis indicates the market is characterized by demand of Qd = 200 - P and supply of Qs = P - 20. Solve for equilibrium price P* and quantity Q*. Depict the supply and demand curves on the usual P, Q diagram. Label all intercepts. Clearly indicate and label the market equilibrium. Graphically indicate the areas of...
Consider an industry that is competitive with N firms and has the following market demand and...
 Consider an industry that is competitive with N firms and has the following market demand and supply. To start with, suppose there is no other relevant fact or issue at play. Thus, the market D and S looks as in this graph, Figure 1. a) Depict such a graph on your paper and indicate the following: Market price and output, the socially optimal output, the size of consumer surplus, and the size of producer surplus. b) Now, suppose that overnight...
Homework 2: Welfare Analysis 1. Let's say that the market for barley in the US is:...
 Homework 2: Welfare Analysis 1. Let's say that the market for barley in the US is: Demand function: Q = 4 - VP: Supply function: Q = P-4 where P is price in S/bushel and Q is quantity in millions of bushels sold. Find the equilibrium price and quantity for this competitive market solution and graph it. Let's say that the world price is $7/bushel. Calculate and show graphically the amount produced domestically and the amount consumed domestically Using letters...
4) Consider the following perfectly competitive market for board games: (Do NOT round values.) (2...
 4) Consider the following perfectly competitive market for board games: (Do NOT round values.) (22 marks) Q-204P Qd-300 - P a) Calculate initial equilibrium supply and demand. b) Calculate consumer and producer surplus. Show graphically c) Realizing that board games are awesome, the government creates a $50 price ceiling. Recalculate new equilibrium quantities. Show graphically d) Calculate consumer surplus, producer surplus, and deadweight loss for the worst case scenario. Show graphically
4) Consider the following perfectly competitive market for board...
4) Consider the following perfectly competitive market for board games: (Do NOT round values.) (22 marks) Q-204P Qd-300 - P a) Calculate initial equilibrium supply and demand. b) Calculate consumer and producer surplus. Show graphically c) Realizing that board games are awesome, the government creates a $50 price ceiling. Recalculate new equilibrium quantities. Show graphically d) Calculate consumer surplus, producer surplus, and deadweight loss for the worst case scenario. Show graphically
4) Consider the following perfectly competitive market for board...
Practice Question 4. The inverse demand curve a monopoly faces is p = 30 – Q....
 Practice Question 4. The inverse demand curve a monopoly faces is p = 30 – Q. The firm's total cost function is C(Q) = 0.5Q² and thus marginal cost function is MC(Q) = Q. (a) Determine the monopoly quantity, price and profit, and calculate the CS, PS and social welfare under the monopoly. (b) Determine the socially optimal outcome and calculate the CS, PS and social welfare under the social optimum. (c) Calculate the deadweight loss due to the monopolist...
1) A good that generates a negative externality is sold in a competitive market. Demand is...
1) A good that generates a negative externality is sold in a competitive market. Demand is defined by P(Q)=600-2Q and supply is defined by P(Q)=Q. The externality from production is E(Q)=0.5Q2. a)What is the quantity produced in the competitive equilibrium? Q= b)What is the price in the competitive equilibrium? P= c)What is consumer surplus in the competitive equilibrium? CS= d)What is producer surplus in the competitive equilibrium? PS= e)What is the total value of the externality in the competitive equilibrium?...
A monopolist faces inverse demand P = on TC(Q) = cQ. (a) Find the optimal price,...
 A monopolist faces inverse demand P = on TC(Q) = cQ. (a) Find the optimal price, P, and quantity, QM (b) Solve for the monopolist's optimal profits, TM (c) Graph the equilibrium and show consumer surplus, producer surplus and deadweight loss. Be 150 -3Q and total cost functi careful with the marginal cost curve. (d) Compute CS and PS. These will be functions of the cost parameter c. (e) Compute DWL. Similarly, it will be functions of the cost parameter...
[1] INote that AC in the Figure below is ATC] For the following perfectly competitive industry...
 [1] INote that AC in the Figure below is ATC] For the following perfectly competitive industry (market) and firm below, assume that P1 $6.80, P2 $3.80, Q1 1200, and Q2 870. Calculate parts (a) (h) below: Indvidual firm Price Industry Price MC Ms AR-MR MS2 P1 AC P2 AR2 MR2 Md Industry Output QFirm's Output (a) At Demand/P1, Firm's Total Revenue (TR) (b) At Demand/P1, Firm's Average Total Cost (ATC) use AC on graph (c) At Demand/P1, Profit (T) (d)...
Problem Setup Analyze each of the following three scenarios (Efficient, A, and B) describing the market...
 Problem Setup
Analyze each of the following three scenarios (Efficient, A, and
B) describing the market for widgets.
Consider the market for widgets. Consumers have a market
(aggregate)
marginal benefit curve of MB = 50 – 3Q. The supplier(s) in that
market have a market (aggregate) marginal cost curve of MC = 10 +
2Q.
Efficient Outcome
● Use the marginal benefit and marginal cost equations given
above to determine the efficient quantity
Equilibrium with Marginal Cost Pricing (Scenario
A)...
Problem Setup
Analyze each of the following three scenarios (Efficient, A, and
B) describing the market for widgets.
Consider the market for widgets. Consumers have a market
(aggregate)
marginal benefit curve of MB = 50 – 3Q. The supplier(s) in that
market have a market (aggregate) marginal cost curve of MC = 10 +
2Q.
Efficient Outcome
● Use the marginal benefit and marginal cost equations given
above to determine the efficient quantity
Equilibrium with Marginal Cost Pricing (Scenario
A)...
5) (28 points) Suppose the demand and supply for flu shots are given by pd =...
 5) (28 points) Suppose the demand and supply for flu shots are given by pd = 1200-Q ps = 440 + Q Suppose flu shots generate a positive externality, and the marginal external benefit (MEB) is MEB=60 -0.050. (a) Derive the marginal social benefit (MSB) curve. (b) Draw the Demand, Supply, and MSB curves on the same graph (with P on the vertical axis and Q on the horizontal axis) and clearly indicate the curves in your graph. (c) Calculate...
 Consider an industry that is competitive with N firms and has the following market demand and supply. To start with, suppose there is no other relevant fact or issue at play. Thus, the market D and S looks as in this graph, Figure 1. a) Depict such a graph on your paper and indicate the following: Market price and output, the socially optimal output, the size of consumer surplus, and the size of producer surplus. b) Now, suppose that overnight...
 Homework 2: Welfare Analysis 1. Let's say that the market for barley in the US is: Demand function: Q = 4 - VP: Supply function: Q = P-4 where P is price in S/bushel and Q is quantity in millions of bushels sold. Find the equilibrium price and quantity for this competitive market solution and graph it. Let's say that the world price is $7/bushel. Calculate and show graphically the amount produced domestically and the amount consumed domestically Using letters...
 4) Consider the following perfectly competitive market for board games: (Do NOT round values.) (22 marks) Q-204P Qd-300 - P a) Calculate initial equilibrium supply and demand. b) Calculate consumer and producer surplus. Show graphically c) Realizing that board games are awesome, the government creates a $50 price ceiling. Recalculate new equilibrium quantities. Show graphically d) Calculate consumer surplus, producer surplus, and deadweight loss for the worst case scenario. Show graphically
4) Consider the following perfectly competitive market for board...
4) Consider the following perfectly competitive market for board games: (Do NOT round values.) (22 marks) Q-204P Qd-300 - P a) Calculate initial equilibrium supply and demand. b) Calculate consumer and producer surplus. Show graphically c) Realizing that board games are awesome, the government creates a $50 price ceiling. Recalculate new equilibrium quantities. Show graphically d) Calculate consumer surplus, producer surplus, and deadweight loss for the worst case scenario. Show graphically
4) Consider the following perfectly competitive market for board...
 Practice Question 4. The inverse demand curve a monopoly faces is p = 30 – Q. The firm's total cost function is C(Q) = 0.5Q² and thus marginal cost function is MC(Q) = Q. (a) Determine the monopoly quantity, price and profit, and calculate the CS, PS and social welfare under the monopoly. (b) Determine the socially optimal outcome and calculate the CS, PS and social welfare under the social optimum. (c) Calculate the deadweight loss due to the monopolist...
 A monopolist faces inverse demand P = on TC(Q) = cQ. (a) Find the optimal price, P, and quantity, QM (b) Solve for the monopolist's optimal profits, TM (c) Graph the equilibrium and show consumer surplus, producer surplus and deadweight loss. Be 150 -3Q and total cost functi careful with the marginal cost curve. (d) Compute CS and PS. These will be functions of the cost parameter c. (e) Compute DWL. Similarly, it will be functions of the cost parameter...
 [1] INote that AC in the Figure below is ATC] For the following perfectly competitive industry (market) and firm below, assume that P1 $6.80, P2 $3.80, Q1 1200, and Q2 870. Calculate parts (a) (h) below: Indvidual firm Price Industry Price MC Ms AR-MR MS2 P1 AC P2 AR2 MR2 Md Industry Output QFirm's Output (a) At Demand/P1, Firm's Total Revenue (TR) (b) At Demand/P1, Firm's Average Total Cost (ATC) use AC on graph (c) At Demand/P1, Profit (T) (d)...
 Problem Setup
Analyze each of the following three scenarios (Efficient, A, and
B) describing the market for widgets.
Consider the market for widgets. Consumers have a market
(aggregate)
marginal benefit curve of MB = 50 – 3Q. The supplier(s) in that
market have a market (aggregate) marginal cost curve of MC = 10 +
2Q.
Efficient Outcome
● Use the marginal benefit and marginal cost equations given
above to determine the efficient quantity
Equilibrium with Marginal Cost Pricing (Scenario
A)...
Problem Setup
Analyze each of the following three scenarios (Efficient, A, and
B) describing the market for widgets.
Consider the market for widgets. Consumers have a market
(aggregate)
marginal benefit curve of MB = 50 – 3Q. The supplier(s) in that
market have a market (aggregate) marginal cost curve of MC = 10 +
2Q.
Efficient Outcome
● Use the marginal benefit and marginal cost equations given
above to determine the efficient quantity
Equilibrium with Marginal Cost Pricing (Scenario
A)...
 5) (28 points) Suppose the demand and supply for flu shots are given by pd = 1200-Q ps = 440 + Q Suppose flu shots generate a positive externality, and the marginal external benefit (MEB) is MEB=60 -0.050. (a) Derive the marginal social benefit (MSB) curve. (b) Draw the Demand, Supply, and MSB curves on the same graph (with P on the vertical axis and Q on the horizontal axis) and clearly indicate the curves in your graph. (c) Calculate...
Most questions answered within 3 hours.
-
The following results were obtained as
part of a multiple regression analysis involving 3 independent
variables:...
asked 46 minutes ago -
The time to complete a standardized exam is approximately normal
with a mean of 70 minutes...
asked 2 hours ago -
Two thousand randomly selected adults were asked whether or not
they have ever shopped on the...
asked 2 hours ago -
Estimate the diffusion coefficient for methyl phenyl sulfide in
water at 25 degrees Celcius.
asked 2 hours ago -
10.g of a certain metal absorb 40. cal of heat and the temperature
is abserved to...
asked 3 hours ago -
How many milliliters of 0.0695 M Ca( OH)
2would be required to exactly neutralize 176 mL...
asked 3 hours ago -
A telephone survey uses a random digit dialing machine to call
subjects. The random digit dialing...
asked 4 hours ago -
How can having too little or too much of a certain
protein cause problems for an...
asked 5 hours ago -
Assume a muscle has a PCSA = 20 cm2 and Lo = 12 cm. Assume it...
asked 7 hours ago -
What is the yield to maturity of a ten-year, $1,000 bond with a
5.2% coupon rate...
asked 7 hours ago -
A mass m = 5 kg is tied on one end of a rope and is...
asked 7 hours ago -
The Average sales price of single-family houses in Charlotte is
$210,000 with a standard deviation of...
asked 8 hours ago