

Homework Answers
Ans.
| Product Price(P) | Quantity demand(Qd) | Total Revenue(TR) | Marginal Revenue(MR) |
| $2 | 0 | 0 | --- |
| $2 | 1 | $2 | $2 |
| $2 | 2 | $4 | $2 |
| $2 | 3 | $6 | $2 |
| $2 | 4 | $8 | $2 |
| #2 | 5 | $10 | $2 |
Note- 1) TR = P x Q
2) MR = change in TR/ change in Q
a) d. The industry is purely competitive.
Because every firm is a price taker and has a negligible effect on the market price. Market price decided by the supply and demand forces in the market.
b)
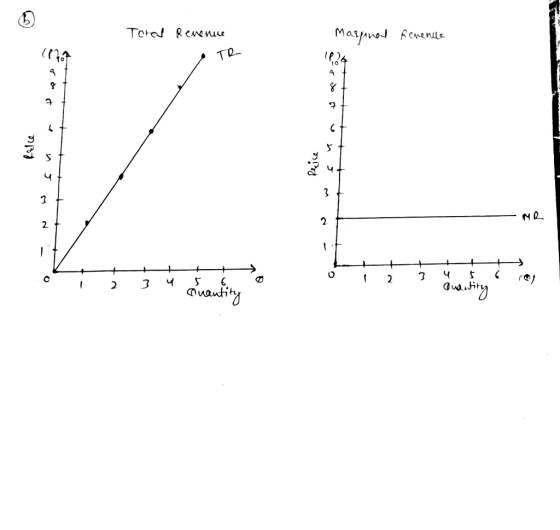
c) a. Demand is perfectly elastic; MR is constant and equal to P
In the competitive market, every firm is a price taker, so, to sell every unit of goods, the producer will charge the same price which leads to elastic demand curve and price is constant which leads to marginal revenue constant and equal to the price
d) True,
Marginal Revenue (MR) = change in TR/ change in Q
Add Answer to:
Use the following demand schedule to determine total revenue and marginal revenue for each possible level...
Use the following demand schedule to determine total revenue and marginal revenue for each possible level...
 Use the following demand schedule to determine total revenue and marginal revenue for each possible level of sales. Instructions: Enter your answers as whole numbers Quantity Product Price Demanded Marginal Revenue Total Revenue $2 10 $
Derivation and Plots of Demand, Marginal Revenue, and Revenue Curves Name Due (worth 50 points) The...
 Derivation and Plots of Demand, Marginal Revenue, and Revenue Curves Name Due (worth 50 points) The equation below represents a linear demand curve. Use the grid (right) for your plots. Write all derivations in the space below. 1) Plot the demand function on the top set of axes. Q = 40000-100P, 2) The price function is the inverse of the demand function. Write this inverse below. to 3) Use the price function to obtain the total revenue function (TR). Write...
The graph to the right shows the Marginal Cost (MC), Average Total Cost (ATC), and Marginal...
 The graph to the right shows the Marginal Cost (MC), Average Total Cost (ATC), and Marginal Revenue (MR) curves for a perfectly (or purely) competitive firm. Note that the Demand (D) curve is the same as the MR curve for such a MR/MC ($) firm. Assume that the cost curves here are representative of other firms in the industry. Given the current price, this firm will: earn a positive profit. earn a negative profit. earn zero economic profit. In the...
Assume that the following marginal costs exist in catfish production: Instructions: Complete the table below. If...
 Assume that the following marginal costs exist in catfish production: Instructions: Complete the table below. If you are entering any negative numbers be sure to include a negative sign (-) in front of those numbers. Quantity produced (units per day) 10 11 12 13 14 15 16 Marginal cost (per unit) $4 6 8 10 12 14 16 Price (per unit) - $25 24 23 22 - 21 - 20 19 - 18 Quantity demanded (units per day) 10 11...
1) A perfectly competitive firm faces the following Total revenue, Total cost and Marginal cost functions:...
1) A perfectly competitive firm faces the following Total revenue, Total cost and Marginal cost functions: TR = 10Q TC = 2 + 2Q + Q2 MC = 2 + 2Q At the level of output maximizing profit , the above firm's level of economic profit is A) $0 B) $4 C) $6 D) $8 *Additional information after I did the math: The price this firm charges for its product is $10, the level of output maximizing profit is 4...
Table 2 Shows Media Cable’s demand table, total revenue, and marginal revenue at each price. Why,...
Table 2 Shows Media Cable’s demand table, total revenue, and marginal revenue at each price. Why, at any price lower than $130, is the marginal revenue from an additional sale less than the price? Table 2 Price Amount Demanded Total Revenue Marginal Revenue $160 0 $0 n/a $130 90 $11,700 $130.00 $100 200 $20,000 $75.45 $80 350 $28,000 $53.33 $40 600 $24,000 -$16.00 $0 850 $0 -$96 .00 Question 5 options: a) Lowering the price means that Media Cable lowers...
The table below shows the costs and demand for the clove oil industry. Total Revenue Marginal...
 The table below shows the costs and demand for the clove oil industry. Total Revenue Marginal Revenue Marginal Cost Total Cost Total Profit/Loss Quantity Price 136 162 190 a. Complete the table above. b. If this industry was perfectly competitive, what would be the output, price, and total industry profit/loss? Output: Price: $0 Profit/loss: $ c. If this industry was a monopoly industry, what would be the output, price, and total industry profit/loss? Output: O Price: $0 Profit/loss: $0
Take a look at the statements below about a purely (or perfectly) competitive market. Indicate whether...
 Take a look at the statements below about a purely (or perfectly) competitive market. Indicate whether each statement is true or false by moving the true or false labels to the appropriate boxes. 1. In general, the market demand curve in a purely competitive market is perfectly elastic. False True 2. In general, an individual firm in a purely competitive market faces a perfectly elastic demand curve. 3. An individual firm in a purely competitive market can obtain a higher...
The graph shows the demand (D), marginal revenue (MR), and marginal cost (MC) curves for a...
 The graph shows the demand (D), marginal revenue (MR),
and marginal cost (MC) curves for a monopolist. Use the area tool
to outline the region corresponding to the deadweight loss that is
due to the market being monopolistic rather than competitive. Your
answer should be a triangle drawn with three corners.
Thank you.
The graph shows the demand (D), marginal revenue (MR), and marginal cost (MC curves for a monopolist. Use the area tool to outline the region corresponding to...
The graph shows the demand (D), marginal revenue (MR),
and marginal cost (MC) curves for a monopolist. Use the area tool
to outline the region corresponding to the deadweight loss that is
due to the market being monopolistic rather than competitive. Your
answer should be a triangle drawn with three corners.
Thank you.
The graph shows the demand (D), marginal revenue (MR), and marginal cost (MC curves for a monopolist. Use the area tool to outline the region corresponding to...
The following table shows demand and marginal cost for a monopolist. Calculate marginal revenue (MR) at...
 The following table shows demand and marginal cost for a monopolist. Calculate marginal revenue (MR) at each quantity. (Enter your response as an integer.) Output (units) (Q) Price per Unit (P) Marginal Revenue Marginal (MR) Cost (MC) 0 10 9 1 2 8 2 3 7 3 4 6 4 5 5 5 A profit-maximizing monopolist will produce units and set a price of $
 Use the following demand schedule to determine total revenue and marginal revenue for each possible level of sales. Instructions: Enter your answers as whole numbers Quantity Product Price Demanded Marginal Revenue Total Revenue $2 10 $
 Derivation and Plots of Demand, Marginal Revenue, and Revenue Curves Name Due (worth 50 points) The equation below represents a linear demand curve. Use the grid (right) for your plots. Write all derivations in the space below. 1) Plot the demand function on the top set of axes. Q = 40000-100P, 2) The price function is the inverse of the demand function. Write this inverse below. to 3) Use the price function to obtain the total revenue function (TR). Write...
 The graph to the right shows the Marginal Cost (MC), Average Total Cost (ATC), and Marginal Revenue (MR) curves for a perfectly (or purely) competitive firm. Note that the Demand (D) curve is the same as the MR curve for such a MR/MC ($) firm. Assume that the cost curves here are representative of other firms in the industry. Given the current price, this firm will: earn a positive profit. earn a negative profit. earn zero economic profit. In the...
 Assume that the following marginal costs exist in catfish production: Instructions: Complete the table below. If you are entering any negative numbers be sure to include a negative sign (-) in front of those numbers. Quantity produced (units per day) 10 11 12 13 14 15 16 Marginal cost (per unit) $4 6 8 10 12 14 16 Price (per unit) - $25 24 23 22 - 21 - 20 19 - 18 Quantity demanded (units per day) 10 11...
 The table below shows the costs and demand for the clove oil industry. Total Revenue Marginal Revenue Marginal Cost Total Cost Total Profit/Loss Quantity Price 136 162 190 a. Complete the table above. b. If this industry was perfectly competitive, what would be the output, price, and total industry profit/loss? Output: Price: $0 Profit/loss: $ c. If this industry was a monopoly industry, what would be the output, price, and total industry profit/loss? Output: O Price: $0 Profit/loss: $0
 Take a look at the statements below about a purely (or perfectly) competitive market. Indicate whether each statement is true or false by moving the true or false labels to the appropriate boxes. 1. In general, the market demand curve in a purely competitive market is perfectly elastic. False True 2. In general, an individual firm in a purely competitive market faces a perfectly elastic demand curve. 3. An individual firm in a purely competitive market can obtain a higher...
 The graph shows the demand (D), marginal revenue (MR),
and marginal cost (MC) curves for a monopolist. Use the area tool
to outline the region corresponding to the deadweight loss that is
due to the market being monopolistic rather than competitive. Your
answer should be a triangle drawn with three corners.
Thank you.
The graph shows the demand (D), marginal revenue (MR), and marginal cost (MC curves for a monopolist. Use the area tool to outline the region corresponding to...
The graph shows the demand (D), marginal revenue (MR),
and marginal cost (MC) curves for a monopolist. Use the area tool
to outline the region corresponding to the deadweight loss that is
due to the market being monopolistic rather than competitive. Your
answer should be a triangle drawn with three corners.
Thank you.
The graph shows the demand (D), marginal revenue (MR), and marginal cost (MC curves for a monopolist. Use the area tool to outline the region corresponding to...
 The following table shows demand and marginal cost for a monopolist. Calculate marginal revenue (MR) at each quantity. (Enter your response as an integer.) Output (units) (Q) Price per Unit (P) Marginal Revenue Marginal (MR) Cost (MC) 0 10 9 1 2 8 2 3 7 3 4 6 4 5 5 5 A profit-maximizing monopolist will produce units and set a price of $
Most questions answered within 3 hours.
-
Briefly describe an aspect of the strengths perspective that is
consistent with your own understanding of...
asked 26 seconds ago -
Step by step method of using Sparse Identification of Nonlinear
Dynamics (SINDy) to model your own...
asked 8 minutes ago -
3) What are the typical social structures in a global city?
asked 3 hours ago -
Luther Corporation
Consolidated Balance Sheet
December 31, 2019 and 2018 (in $ millions)
Assets
2019
2018...
asked 3 hours ago -
(Expected rate of return and risk) Carter Inc. is evaluating a
security. Calculate the investment’s expected...
asked 5 hours ago -
What specific indicators can point to lack of progress for
African Americans in American society?
asked 6 hours ago -
1-The Electrons in a beam are moving at 2.7×10⁸ m/s in an
electric field of 15000...
asked 7 hours ago -
A gas tank is a vertical cylinder. It has a radius of 1m, a
height of...
asked 7 hours ago -
Accent Software faces the following conditions. All of these
support Accent’s use of a market-penetration pricing...
asked 8 hours ago -
A mathematically inclined friend emails you the following
instructions: "Meet me in the cafeteria the first...
asked 8 hours ago -
A monopoly sells in two countries . The demand curves in the two
countries are p1...
asked 9 hours ago -
A .15kg rubber ball is bounced off a wall. Before hitting the
wall, the ball moves...
asked 10 hours ago