
Homework Answers
As per the HOMEWORKLIB POLICY, answering the first four questions
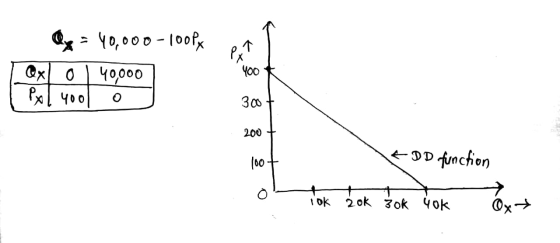
1)
2)
Qx = 40000 - 100Px
100Px = 40000 - Qx
Px = 400 - 0.01Qx : Inverse Demand Function
3)
TR = P*Q
= (400 - 0.01Qx ) * Qx
= 400Qx - 0.01Qx2
4)
MR = Derivative of TR with respect to Qx
= 400 - 0.02Qx

Add Answer to:
Derivation and Plots of Demand, Marginal Revenue, and Revenue Curves Name Due (worth 50 points) The...
The equation below represents a linear demand curve. Use the grid (right) for your plots. Write...
The equation below represents a linear demand curve. Use the grid (right) for your plots. Write all derivations in the space below. l) Plot the demand function on the top set of axes. Your demand function is: Qx = 60000 - 100Px l) Plot the demand function on the top set of axes. 2) The price function is the inverse of the demand function. Write this inverse below. 3) Use the price function to obtain the total revenue function (TR)....
The equation below represents a linear demand curve. Use the grid (right) for your plots. Write...
 The equation below represents a linear demand curve. Use the grid (right) for your plots. Write all derivations in the space below. 1) Plot the demand function on the top set of axes. Qy = 15000 – 200P, 2) The price function is the inverse of the demand function. Write this inverse below. 3) Use the price function to obtain the total revenue function (TR). Write the TR function below. You will plot TR on the lower set of axes...
Use the following demand schedule to determine total revenue and marginal revenue for each possible level...
 Use the following demand schedule to determine total revenue and marginal revenue for each possible level of sales. Instructions: Enter your answers as whole numbers. Product Price Quantity Demanded Total Revenue Marginal Revenue NNNNNN a. What can you conclude about the structure of the industry in which this firm is operating? The industry is purely monopolistic. The industry is purely oligopolistic. The industry is monopolistically competitive. The industry is purely competitive. b. Graph the total-revenue and marginal-revenue curves for this...
Question 3-4 SESSION 13 The marginal revenue is the rate of change in total revenue per...
 Question 3-4
SESSION 13 The marginal revenue is the rate of change in total revenue per unit increase in output, Q The marginal cost is the rate of change in total cost per unit increase in output, Q AR is defined as average revenue per unit for the first Q su ccessive units sold. AR is determined by dividing total reven ue by the quantity sold, Q The AR function is equal to price, P. where Pis given by the...
Question 3-4
SESSION 13 The marginal revenue is the rate of change in total revenue per unit increase in output, Q The marginal cost is the rate of change in total cost per unit increase in output, Q AR is defined as average revenue per unit for the first Q su ccessive units sold. AR is determined by dividing total reven ue by the quantity sold, Q The AR function is equal to price, P. where Pis given by the...
3. The demand function for a good is given as P = 50 - 20. 1)...
 3. The demand function for a good is given as P = 50 - 20. 1) Write down expressions for the TR and MR functions. 2) Find and classify the type of the point price elasticity at price P=10. 3) Calculate the output at which TR is a maximum, and use second order conditions to confirm that it is maximum. 4) Confirm that marginal revenue is zero at maximum point.
1. Use the graph below to answer the questions: 80 70 60 50 40 30 20...
 1. Use the graph below to answer the questions: 80 70 60 50 40 30 20 10 ㄒ ㄧ -- 4 State the equation for the demand curve (inverse demand function) shown in the graph above using the format Px- a - bQx: a. b. State the equation for the demand function implied in the graph using the format Qx-c - dPx c. Find the equation for Total Revenue, where TR is a function of output (Qx) d. Find the...
Willy's widgets, a monopoly, faces the following demand schedule (sales of widgets per month): Price $20 30 40 50 60 70 80 90 100 Quantity 40 35 30 25 20 15 10 5 0 Calculate marginal revenue over each interval in the schedule (for example, between Q
Willy's widgets, a monopoly, faces the following demand schedule (sales of widgets per month): Price $20 30 40 50 60 70 80 90 100 Quantity 40 35 30 25 20 15 10 5 0 Calculate marginal revenue over each interval in the schedule (for example, between Q = 40 and Q=35). Recall that the revenue is the added revenue from an additional unit of production/sales and assume MR is constant within each interval. If marginal cost is constant at $20...
The graph below shows the demand (D), marginal revenue (MR), marginal cost (MC), and average total cost (ATC) curves for a supplier of bottled water to commercial buildings. The firm operates as a local monopoly. Use the area tool to draw the rectangle th
 The graph below shows the demand (D), marginal revenue (MR), marginal cost (MC), and average total cost (ATC) curves for a supplier of bottled water to commercial buildings. The firm operates as a local monopoly. Use the area tool to draw the rectangle that represents the firm's profit if the market quantity is 7,000 bottles.Your answer should be a rectangle with four corners. To refer to the graphing tutorial for this question type, please click here.
3. The market illustrated below has inverse demand p(Q) = 130 - 3Q and industry-wide marginal...
 3. The market illustrated below has inverse demand p(Q) = 130 - 3Q and industry-wide marginal cost MCQ) = 10 + 2Q. If production is competitive, this is the market (inverse) supply curve. If production is consolidated under a monopolist, this is the monopolist's MC curve. a. Suppose there is a monopolist. Explain how marginal revenue for a monopolist is different than for a firm under perfect competition. Then derive the profit-maximizing market outcome (including the monopoly price and quantity...
1. Use the graph below to answer the questions: 80 70 60 50 40 30 20...
 1. Use the graph below to answer the questions: 80 70 60 50 40 30 20 10 State the equation for the demand curve (inverse demand function) shown in the graph above using the format P a-bQi a. b. State the equation for the demand function implied in the graph using the format Q c-dP Find the equation for Total Revenue, where TR is a function of output (Q): c. d. Find the equation for Marginal Revenue, where MR is...
 The equation below represents a linear demand curve. Use the grid (right) for your plots. Write all derivations in the space below. 1) Plot the demand function on the top set of axes. Qy = 15000 – 200P, 2) The price function is the inverse of the demand function. Write this inverse below. 3) Use the price function to obtain the total revenue function (TR). Write the TR function below. You will plot TR on the lower set of axes...
 Use the following demand schedule to determine total revenue and marginal revenue for each possible level of sales. Instructions: Enter your answers as whole numbers. Product Price Quantity Demanded Total Revenue Marginal Revenue NNNNNN a. What can you conclude about the structure of the industry in which this firm is operating? The industry is purely monopolistic. The industry is purely oligopolistic. The industry is monopolistically competitive. The industry is purely competitive. b. Graph the total-revenue and marginal-revenue curves for this...
 Question 3-4
SESSION 13 The marginal revenue is the rate of change in total revenue per unit increase in output, Q The marginal cost is the rate of change in total cost per unit increase in output, Q AR is defined as average revenue per unit for the first Q su ccessive units sold. AR is determined by dividing total reven ue by the quantity sold, Q The AR function is equal to price, P. where Pis given by the...
Question 3-4
SESSION 13 The marginal revenue is the rate of change in total revenue per unit increase in output, Q The marginal cost is the rate of change in total cost per unit increase in output, Q AR is defined as average revenue per unit for the first Q su ccessive units sold. AR is determined by dividing total reven ue by the quantity sold, Q The AR function is equal to price, P. where Pis given by the...
 3. The demand function for a good is given as P = 50 - 20. 1) Write down expressions for the TR and MR functions. 2) Find and classify the type of the point price elasticity at price P=10. 3) Calculate the output at which TR is a maximum, and use second order conditions to confirm that it is maximum. 4) Confirm that marginal revenue is zero at maximum point.
 1. Use the graph below to answer the questions: 80 70 60 50 40 30 20 10 ㄒ ㄧ -- 4 State the equation for the demand curve (inverse demand function) shown in the graph above using the format Px- a - bQx: a. b. State the equation for the demand function implied in the graph using the format Qx-c - dPx c. Find the equation for Total Revenue, where TR is a function of output (Qx) d. Find the...
 3. The market illustrated below has inverse demand p(Q) = 130 - 3Q and industry-wide marginal cost MCQ) = 10 + 2Q. If production is competitive, this is the market (inverse) supply curve. If production is consolidated under a monopolist, this is the monopolist's MC curve. a. Suppose there is a monopolist. Explain how marginal revenue for a monopolist is different than for a firm under perfect competition. Then derive the profit-maximizing market outcome (including the monopoly price and quantity...
 1. Use the graph below to answer the questions: 80 70 60 50 40 30 20 10 State the equation for the demand curve (inverse demand function) shown in the graph above using the format P a-bQi a. b. State the equation for the demand function implied in the graph using the format Q c-dP Find the equation for Total Revenue, where TR is a function of output (Q): c. d. Find the equation for Marginal Revenue, where MR is...
Most questions answered within 3 hours.
-
The blues made its way into many kinds of music. Eric Clapton,
The Beatles, and Elvis...
asked 52 minutes ago -
If you’re standing at the bottom of a hill and asked to evaluate
it while being...
asked 1 hour ago -
1. Which region has taken the lead in the world of
e-waste handling?
a) European Union...
asked 1 hour ago -
A 8.15- g bullet from a 9-mm pistol has a velocity of 366.0 m/s.
It strikes...
asked 3 hours ago -
The outstanding bonds of Alpha Extracts have a yield to maturity
of 7.4 percent and a...
asked 3 hours ago -
The Problem: The Case of the Harmonizing Vacations
Your CEO is exploring partnering with a European...
asked 4 hours ago -
A chemical equation is balanced by adding coefficients in front
of some formulas so that the...
asked 4 hours ago -
From the literature (reference your sources): What are the
lattice parameters of calcite and aragonite? Why...
asked 5 hours ago -
Your system is rejecting the question am asking which is
preceded by a case study. It...
asked 5 hours ago -
3. On January 2, 2000, Larry creates a trust with himself as
trustee. Larry as trustee...
asked 5 hours ago -
A member of the volleyball team spikes the ball. During this
process, she changes the velocity...
asked 5 hours ago -
Are adult gamers less likely to use a gaming console (Xbox,
PlayStation, Wii, etc...) than teen...
asked 6 hours ago