The equation below represents a linear demand curve. Use the grid (right) for your plots. Write...
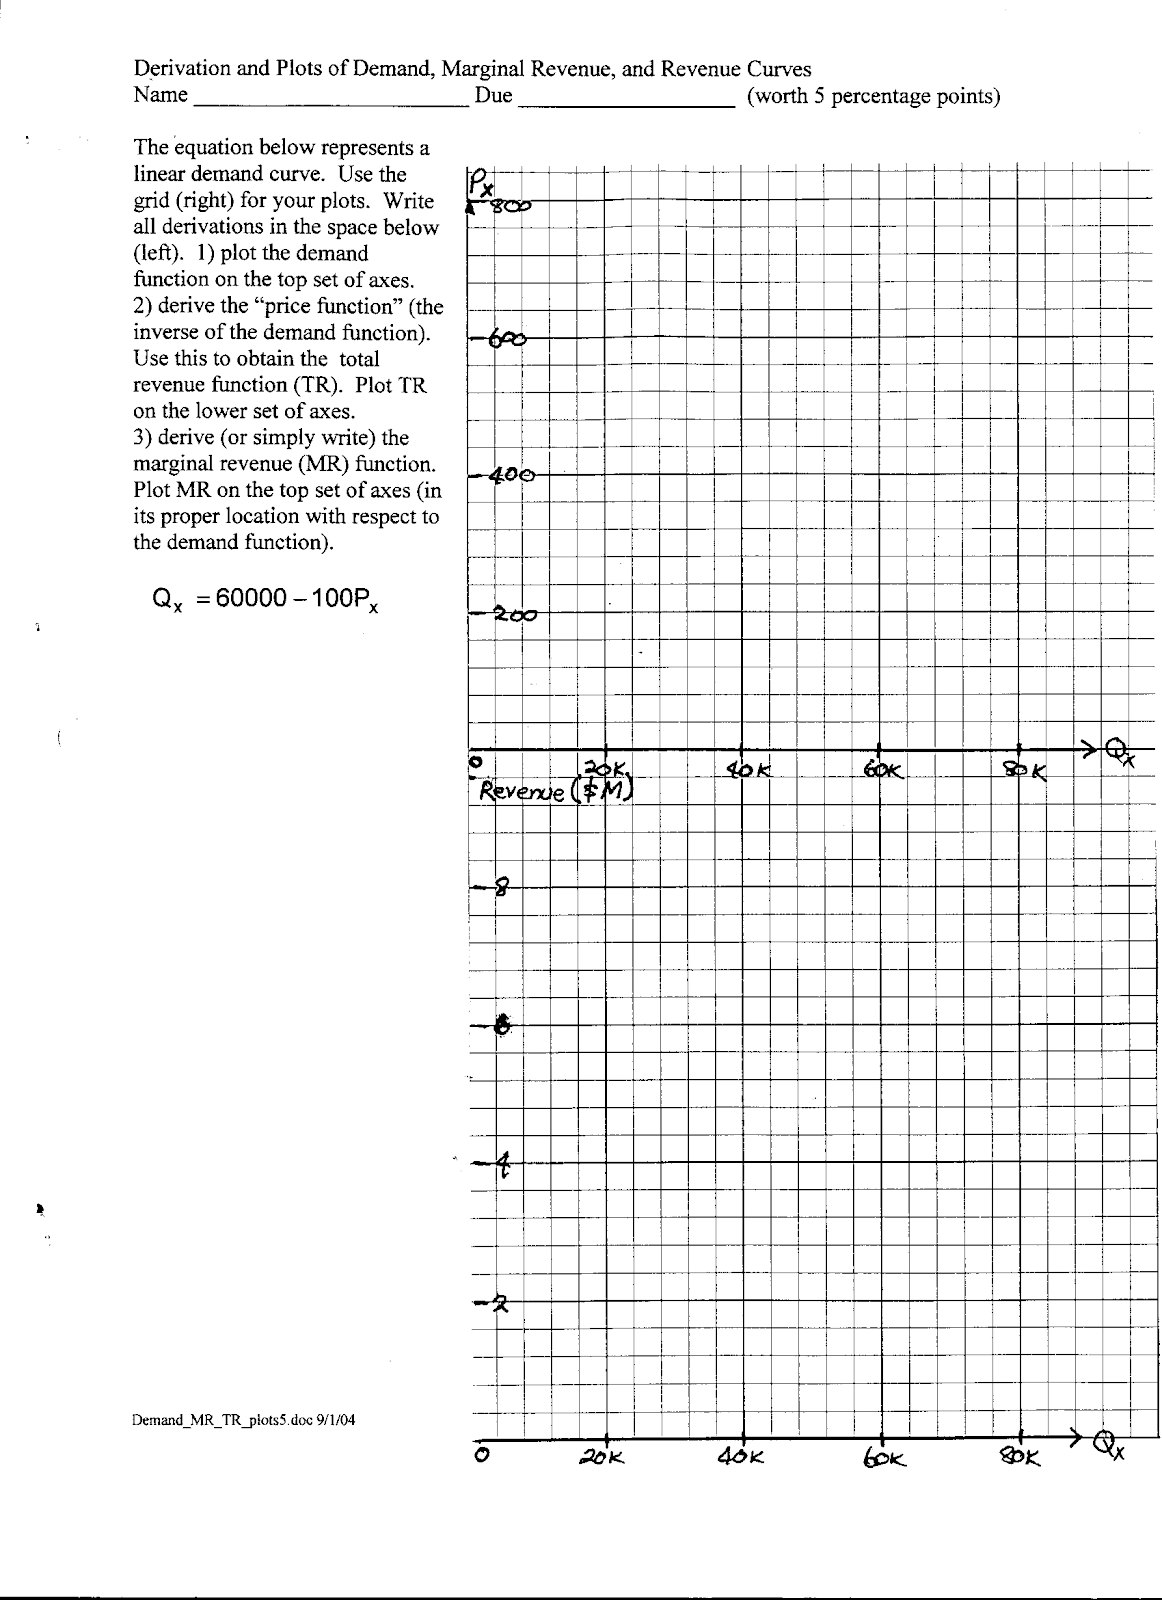
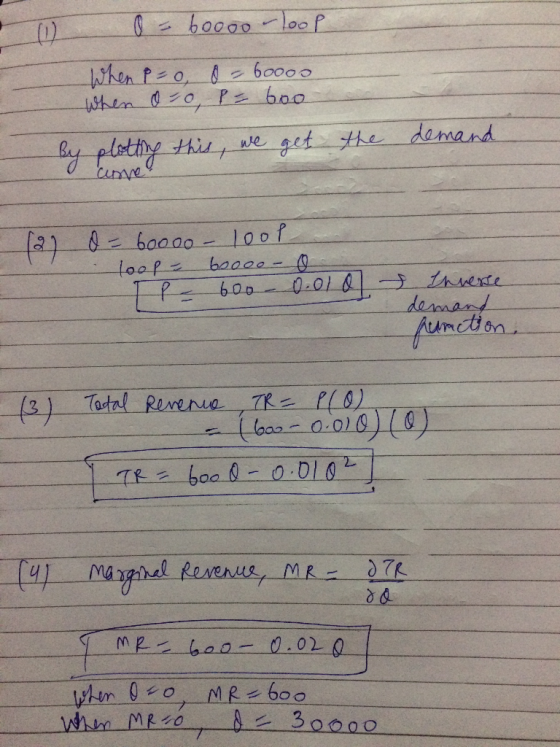
The equation below represents a linear demand curve. Use the grid (right) for your plots. Write all derivations in the space below. l) Plot the demand function on the top set of axes. Your demand function is: Qx = 60000 - 100Px
l) Plot the demand function on the top set of
axes.

2) The price function is the inverse of the demand function. Write this inverse below.
3) Use the price function to obtain the total revenue function (TR). Write the TR function below. You will plot TR on the lower set of axes in step 5.
4) Derive (or simply write) the marginal revenue (MR) function below. Plot MR on the top set of axes (in the proper location with respect to the demand function).
5) Use the TR function (3) to calculate the revenue for each of the seven Qx values below. Use the seven revenues to plot the revenue function properly.
|
Qx |
Revenue |
|
0 |
|
|
10k |
|
|
20k |
|
|
30k |
|
|
40k |
|
|
50k |
|
|
60k |
k means thousand
Homework Answers

Add Answer to:
The equation below represents a linear demand curve. Use the
grid (right) for your plots. Write...
The equation below represents a linear demand curve. Use the grid (right) for your plots. Write...
 The equation below represents a linear demand curve. Use the grid (right) for your plots. Write all derivations in the space below. 1) Plot the demand function on the top set of axes. Qy = 15000 – 200P, 2) The price function is the inverse of the demand function. Write this inverse below. 3) Use the price function to obtain the total revenue function (TR). Write the TR function below. You will plot TR on the lower set of axes...
Derivation and Plots of Demand, Marginal Revenue, and Revenue Curves Name Due (worth 50 points) The...
 Derivation and Plots of Demand, Marginal Revenue, and Revenue Curves Name Due (worth 50 points) The equation below represents a linear demand curve. Use the grid (right) for your plots. Write all derivations in the space below. 1) Plot the demand function on the top set of axes. Q = 40000-100P, 2) The price function is the inverse of the demand function. Write this inverse below. to 3) Use the price function to obtain the total revenue function (TR). Write...
1. Use the graph below to answer the questions: 80 70 60 50 40 30 20...
 1. Use the graph below to answer the questions: 80 70 60 50 40 30 20 10 ㄒ ㄧ -- 4 State the equation for the demand curve (inverse demand function) shown in the graph above using the format Px- a - bQx: a. b. State the equation for the demand function implied in the graph using the format Qx-c - dPx c. Find the equation for Total Revenue, where TR is a function of output (Qx) d. Find the...
1. Use the graph below to answer the questions: 80 70 60 50 40 30 20...
 1. Use the graph below to answer the questions: 80 70 60 50 40 30 20 10 State the equation for the demand curve (inverse demand function) shown in the graph above using the format P a-bQi a. b. State the equation for the demand function implied in the graph using the format Q c-dP Find the equation for Total Revenue, where TR is a function of output (Q): c. d. Find the equation for Marginal Revenue, where MR is...
 The equation below represents a linear demand curve. Use the grid (right) for your plots. Write all derivations in the space below. 1) Plot the demand function on the top set of axes. Qy = 15000 – 200P, 2) The price function is the inverse of the demand function. Write this inverse below. 3) Use the price function to obtain the total revenue function (TR). Write the TR function below. You will plot TR on the lower set of axes...
 Derivation and Plots of Demand, Marginal Revenue, and Revenue Curves Name Due (worth 50 points) The equation below represents a linear demand curve. Use the grid (right) for your plots. Write all derivations in the space below. 1) Plot the demand function on the top set of axes. Q = 40000-100P, 2) The price function is the inverse of the demand function. Write this inverse below. to 3) Use the price function to obtain the total revenue function (TR). Write...
 1. Use the graph below to answer the questions: 80 70 60 50 40 30 20 10 ㄒ ㄧ -- 4 State the equation for the demand curve (inverse demand function) shown in the graph above using the format Px- a - bQx: a. b. State the equation for the demand function implied in the graph using the format Qx-c - dPx c. Find the equation for Total Revenue, where TR is a function of output (Qx) d. Find the...
 1. Use the graph below to answer the questions: 80 70 60 50 40 30 20 10 State the equation for the demand curve (inverse demand function) shown in the graph above using the format P a-bQi a. b. State the equation for the demand function implied in the graph using the format Q c-dP Find the equation for Total Revenue, where TR is a function of output (Q): c. d. Find the equation for Marginal Revenue, where MR is...
Most questions answered within 3 hours.
-
You are considering the purchase of a share of Edie's common
stock. You expect to sell...
asked 4 minutes ago -
Using the TI-84 calculator, find the area under the standard
normal curve that lies outside the...
asked 2 minutes ago -
Assembly Programming
INCLUDE Irvine32.inc
Make a program that takes a string and a word as inputs...
asked 12 minutes ago -
Can I get a C++ code and output for this program using classes
instead of using...
asked 17 minutes ago -
A 4.0 L flask containing chlorine gas is connected to an
evacuated 3.0 L flask. If...
asked 28 minutes ago -
The number of years of education of self-employed individuals in
the United States has a population...
asked 15 minutes ago -
Write an essay containing your thoughts on
whether corporations should be limited in the amount of...
asked 29 minutes ago -
Given the following two sequences x (n)=[3 , 11,7 ,0 ,−1, 4 ,2
],−3≤n≤ 3 ;...
asked 29 minutes ago -
What is the minimal sample size needed for a 95% confidence
interval to have a maximal...
asked 30 minutes ago -
1. Methods of collecting data - Experiments and direct
observation
In each of the following situations,...
asked 44 minutes ago -
Each protein is composed of a maximum of ____________ different
amino acids in varying numbers and...
asked 1 hour ago -
One member in the comp set that did not have supply, demand, and
revenue data. What...
asked 39 minutes ago