4. The table below shows an NHL team’s estimated total cost and marginal revenue for a...
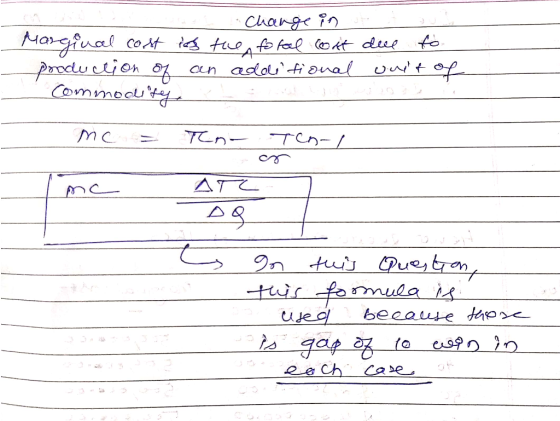
4. The table below shows an NHL team’s estimated total cost and marginal revenue for a given number of wins. Based on this information, how many wins would maximize the team’s profit?
Wins Total Cost Marginal Revenue
20 $1,000,000.00 $70,000.00
30 $1,500,000.00 $60,000.00
40 $2,000,000.00 $50,000.00
50 $2,500,000.00 $40,000.00
60 $3,000,000.00 $30,000.00
70 $3,500,000.00 $20,000.00
Homework Answers

Add Answer to:
4. The table below shows an NHL team’s estimated total cost and
marginal revenue for a...
1. The graph below shows marginal cost, marginal revenue, and average total cost for a company...
 1. The graph below shows marginal cost, marginal revenue, and average total cost for a company operating in a perfectly competitive market. In the short-run, the company maximizes profit by producing at point E. Is the company productively efficient? Explain. 16 Marginal cost 14 12 10 Marginal Cost/Marginal Revenue ($) 8 6 E Average cost Marginal revenue 4 2 C' 0 0 20 40 100 120 140 60 80 Quantity
The table below shows the costs and demand for the clove oil industry. Total Revenue Marginal...
 The table below shows the costs and demand for the clove oil industry. Total Revenue Marginal Revenue Marginal Cost Total Cost Total Profit/Loss Quantity Price 136 162 190 a. Complete the table above. b. If this industry was perfectly competitive, what would be the output, price, and total industry profit/loss? Output: Price: $0 Profit/loss: $ c. If this industry was a monopoly industry, what would be the output, price, and total industry profit/loss? Output: O Price: $0 Profit/loss: $0
The figure at right shows the demand curve, marginal revenue curve, and cost curves for a...
 The figure at right shows the demand curve, marginal revenue curve, and cost curves for a monopolist. 100- To the nearest unit, the profit-maximizing quantity for the 90- units. monopolist is 80- MC To the nearest dollar, the profit-maximizing price for the 70- monopolist is $ 60+ ATC To the nearest dollar, total revenue for the monopolist is $ 50- and total cost is $ 40+ 30- To the nearest dollar, the monopolist's profit is $ 20- D 10- MR:...
The graph below shows a monopolist's demand (D), marginal revenue (MR), marginal cost (MC), and average...
 The graph below shows a monopolist's demand (D), marginal
revenue (MR), marginal cost (MC), and average total cost (ATC)
curves. Management wants to adjust the production output quantity
to maximize the firm's profits. What quantity should the firm aim
for?
Give your answer by dragging the Q line to a new position to mark
the quantity at which profit is as large as possible.
Price and cost ATC MC MR Quantity
The graph below shows a monopolist's demand (D), marginal
revenue (MR), marginal cost (MC), and average total cost (ATC)
curves. Management wants to adjust the production output quantity
to maximize the firm's profits. What quantity should the firm aim
for?
Give your answer by dragging the Q line to a new position to mark
the quantity at which profit is as large as possible.
Price and cost ATC MC MR Quantity
Solution: Total revenue - price*quantity Profit- total revenue - total cost Marginal revenue change in revenue/change...
 Solution: Total revenue - price*quantity Profit- total revenue - total cost Marginal revenue change in revenue/change in quantitty Average total cost-total cost/quantity Marginal Marginal Change Average al rofirevenue TotalTotal revenue cost Quantity Price profit cost 0 0 16 16 15 30 14 42 13 52 12 60 11 66 10 70 20 4 16 300 36 6 12 4210 10 501 63 з 16 84-14 4 -4 14 4 12 4 4 10.5 10 8 13 10.5 17 10 We...
The table below shows the total cost (TC) and marginal cost (MC) for Choco Lovers, a...
 The table below shows the total cost (TC) and marginal cost (MC) for Choco Lovers, a monopolistic firm producing different quantities of chocolate gift boxes. Fill in the blanks in the table. Quantity Total Cost Marginal Cost Marginal Revenue Price $31 29 Total Revenue $0 725 810 $50 100 25 30 27 107.5 1.5 L 17 35 25 117.5 13 40 132.5 9 23 21 19 920 945 45 50 950 192.5 7 Instructions: Enter your answers as whole numbers....
The table below shows the total cost (TC) and marginal cost (MC) for Choco Lovers, a...
 The table below shows the total cost (TC) and marginal cost (MC) for Choco Lovers, a monopolistic firm producing different quantities of chocolate gift boxes. Fill in the blanks in the table. Total Revenue Marginal Cost Marginal Revenue Total Cost Quantity Price 0 $ 31 0 50 100 S 25 29 725 2 30 810 108 2 17 35 25 118 13 23 40 920 133 9 45 21 945 50 19 950 193 Instructions: Enter your answers as whole...
Fill out the table, answer questions at the end. Avg Total Cost Total Marginal Marginal Revenue Revenue Cost Perfect Co...
 Fill out the table, answer
questions at the end.
Avg Total Cost Total Marginal Marginal Revenue Revenue Cost Perfect Competition Price of output: $10 Fixed costs: $200 Avg Variable Fixed Total Variable Avg Fixed Output Cost Cost Cost Cost Cost $0 10 $50 $250 $20.00 20 $90 $4.50 30 $160 $360 $5.33 $6.67 $225 $300 $500 $6.00 $4.00 $395 70 $510 $710 $7.29 $2.86 80 $640 $8.00 1. What is the profit-maximizing level of output? 2. What are profits at...
Fill out the table, answer
questions at the end.
Avg Total Cost Total Marginal Marginal Revenue Revenue Cost Perfect Competition Price of output: $10 Fixed costs: $200 Avg Variable Fixed Total Variable Avg Fixed Output Cost Cost Cost Cost Cost $0 10 $50 $250 $20.00 20 $90 $4.50 30 $160 $360 $5.33 $6.67 $225 $300 $500 $6.00 $4.00 $395 70 $510 $710 $7.29 $2.86 80 $640 $8.00 1. What is the profit-maximizing level of output? 2. What are profits at...
The table below shows the marginal revenue and costs for a monopolist. Demand, Costs, and Revenues...
 The table below shows the marginal revenue and costs for a monopolist. Demand, Costs, and Revenues Price Quantity Marginal Revenue (dollars) Demanded (dollars) $130 200 $130 120 300 100 110 400 80 100 500 60 90 600 40 80 700 20 Marginal Cost (dollars) $25 32 40 Average Total Cost (dollars) $139.00 103.30 87.50 82.00 77.00 77.00 60 52 77 Instructions: Enter your answers as a whole number. If you are entering any negative numbers be sure to include a...
Table 2 shows Media Cable’s the demand table, total revenue, and marginal revenue at each price....
Table 2 shows Media Cable’s the demand table, total revenue, and marginal revenue at each price. Media Cable’s marginal cost per cable package is $75.45. What is the profit maximizing quantity and price for Media Cable? Table 2 Price Amount Demanded Total Revenue Marginal Revenue $160 0 $0 n/a $130 90 $11,700 $130.00 $100 200 $20,000 $75.45 $80 350 $28,000 $53.33 $40 600 $24,000 -$16.00 $0 850 $0 -$96.00
 1. The graph below shows marginal cost, marginal revenue, and average total cost for a company operating in a perfectly competitive market. In the short-run, the company maximizes profit by producing at point E. Is the company productively efficient? Explain. 16 Marginal cost 14 12 10 Marginal Cost/Marginal Revenue ($) 8 6 E Average cost Marginal revenue 4 2 C' 0 0 20 40 100 120 140 60 80 Quantity
 The table below shows the costs and demand for the clove oil industry. Total Revenue Marginal Revenue Marginal Cost Total Cost Total Profit/Loss Quantity Price 136 162 190 a. Complete the table above. b. If this industry was perfectly competitive, what would be the output, price, and total industry profit/loss? Output: Price: $0 Profit/loss: $ c. If this industry was a monopoly industry, what would be the output, price, and total industry profit/loss? Output: O Price: $0 Profit/loss: $0
 The figure at right shows the demand curve, marginal revenue curve, and cost curves for a monopolist. 100- To the nearest unit, the profit-maximizing quantity for the 90- units. monopolist is 80- MC To the nearest dollar, the profit-maximizing price for the 70- monopolist is $ 60+ ATC To the nearest dollar, total revenue for the monopolist is $ 50- and total cost is $ 40+ 30- To the nearest dollar, the monopolist's profit is $ 20- D 10- MR:...
 The graph below shows a monopolist's demand (D), marginal
revenue (MR), marginal cost (MC), and average total cost (ATC)
curves. Management wants to adjust the production output quantity
to maximize the firm's profits. What quantity should the firm aim
for?
Give your answer by dragging the Q line to a new position to mark
the quantity at which profit is as large as possible.
Price and cost ATC MC MR Quantity
The graph below shows a monopolist's demand (D), marginal
revenue (MR), marginal cost (MC), and average total cost (ATC)
curves. Management wants to adjust the production output quantity
to maximize the firm's profits. What quantity should the firm aim
for?
Give your answer by dragging the Q line to a new position to mark
the quantity at which profit is as large as possible.
Price and cost ATC MC MR Quantity
 Solution: Total revenue - price*quantity Profit- total revenue - total cost Marginal revenue change in revenue/change in quantitty Average total cost-total cost/quantity Marginal Marginal Change Average al rofirevenue TotalTotal revenue cost Quantity Price profit cost 0 0 16 16 15 30 14 42 13 52 12 60 11 66 10 70 20 4 16 300 36 6 12 4210 10 501 63 з 16 84-14 4 -4 14 4 12 4 4 10.5 10 8 13 10.5 17 10 We...
 The table below shows the total cost (TC) and marginal cost (MC) for Choco Lovers, a monopolistic firm producing different quantities of chocolate gift boxes. Fill in the blanks in the table. Quantity Total Cost Marginal Cost Marginal Revenue Price $31 29 Total Revenue $0 725 810 $50 100 25 30 27 107.5 1.5 L 17 35 25 117.5 13 40 132.5 9 23 21 19 920 945 45 50 950 192.5 7 Instructions: Enter your answers as whole numbers....
 The table below shows the total cost (TC) and marginal cost (MC) for Choco Lovers, a monopolistic firm producing different quantities of chocolate gift boxes. Fill in the blanks in the table. Total Revenue Marginal Cost Marginal Revenue Total Cost Quantity Price 0 $ 31 0 50 100 S 25 29 725 2 30 810 108 2 17 35 25 118 13 23 40 920 133 9 45 21 945 50 19 950 193 Instructions: Enter your answers as whole...
 Fill out the table, answer
questions at the end.
Avg Total Cost Total Marginal Marginal Revenue Revenue Cost Perfect Competition Price of output: $10 Fixed costs: $200 Avg Variable Fixed Total Variable Avg Fixed Output Cost Cost Cost Cost Cost $0 10 $50 $250 $20.00 20 $90 $4.50 30 $160 $360 $5.33 $6.67 $225 $300 $500 $6.00 $4.00 $395 70 $510 $710 $7.29 $2.86 80 $640 $8.00 1. What is the profit-maximizing level of output? 2. What are profits at...
Fill out the table, answer
questions at the end.
Avg Total Cost Total Marginal Marginal Revenue Revenue Cost Perfect Competition Price of output: $10 Fixed costs: $200 Avg Variable Fixed Total Variable Avg Fixed Output Cost Cost Cost Cost Cost $0 10 $50 $250 $20.00 20 $90 $4.50 30 $160 $360 $5.33 $6.67 $225 $300 $500 $6.00 $4.00 $395 70 $510 $710 $7.29 $2.86 80 $640 $8.00 1. What is the profit-maximizing level of output? 2. What are profits at...
 The table below shows the marginal revenue and costs for a monopolist. Demand, Costs, and Revenues Price Quantity Marginal Revenue (dollars) Demanded (dollars) $130 200 $130 120 300 100 110 400 80 100 500 60 90 600 40 80 700 20 Marginal Cost (dollars) $25 32 40 Average Total Cost (dollars) $139.00 103.30 87.50 82.00 77.00 77.00 60 52 77 Instructions: Enter your answers as a whole number. If you are entering any negative numbers be sure to include a...
Most questions answered within 3 hours.
-
Calculate the pH of each of the following solutions.
0.50 M HBr
3.1×10⁻⁴ M KOH
4.2×10⁻⁵...
asked 48 minutes ago -
For the year ended December 31, Depot Max’s cost of merchandise
sold was $85,600. Inventory at the...
asked 47 minutes ago -
Week 10 - Professional Memo Assignment
Professional Memo Assignment
Your mission for this week, should you...
asked 52 minutes ago -
Write a Python program that stores the data for each
player on the team, and it...
asked 1 hour ago -
In
the last 3 months, mike never knows when he is going to get his
allowance...
asked 1 hour ago -
Is Ca(OH)2 a Bronsted base, Lewis base, or both? Why?
asked 1 hour ago -
1A- Why don’t voters complain about U.S. tariffs on imported
sugar?
Because sugar is only a...
asked 1 hour ago -
Cash Payback Period
Primera Banco is evaluating two capital investment proposals for
a drive-up ATM kiosk,...
asked 1 hour ago -
Create a button in Swift (Xcode) that will create a charge,
create a charge using Stripe's...
asked 1 hour ago -
The reaction rate of CO and NO2 in the reaction
CO(g) + NO2(g) → CO2(g) +...
asked 1 hour ago -
Imagine that a chemist puts 6.40 mol each of
C3H8 and O2 in a 1.00-L container...
asked 1 hour ago -
How much money should be invested today in order to have $8340
at the end of...
asked 1 hour ago