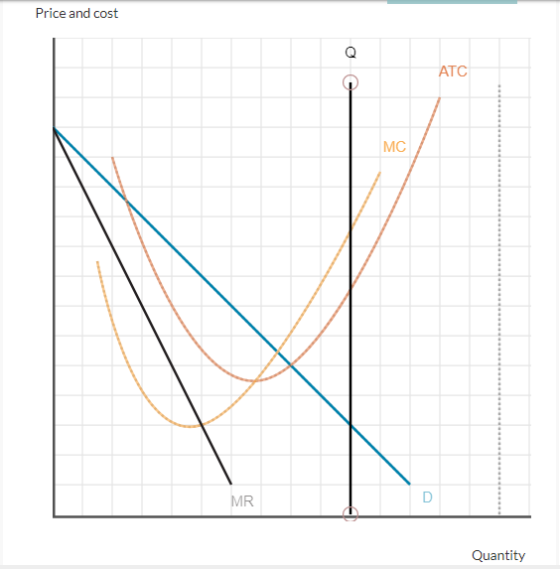
The graph below shows a monopolist's demand (D), marginal
revenue (MR), marginal cost (MC), and average total cost (ATC)
curves. Management wants to adjust the production output quantity
to maximize the firm's profits. What quantity should the firm aim
for?
Give your answer by dragging the Q line to a new position to mark
the quantity at which profit is as large as possible.
Homework Answers
Answer
The firm maximizes profit at MR=MC

Add Answer to:
The graph below shows a monopolist's demand (D), marginal
revenue (MR), marginal cost (MC), and average...
The graph below shows a monopolist's demand (D), marginal revenue (MR), marginal cost (MC), and average total cost (ATC) curves. Management wants to adjust the production output quantity to maximize the firm's profits. What quantity should the firm aim fo
 The graph below shows a monopolist's demand (D), marginal revenue (MR), marginal cost (MC), and average total cost (ATC) curves. Management wants to adjust the production output quantity to maximize the firm's profits. What quantity should the firm aim for?Give your answer by dragging the Q line to a new position to mark the quantity at which profit is as large as possible. To refer to the graphing tutorial for this question type, please click here.
The graph shows a monopolist's demand (D), marginal revenue (MR), marginal cost (MC), and average total...
 The graph shows a monopolist's demand (D), marginal revenue (MR), marginal cost (MC), and average total cost (ATC) curves. Despite having the market all to itself, the firm has struggled to make money. Suppose that the firm is sold,and the new owner is initially less intent on maximizing profits than on simply making a profit. What range of production quantities will low the frm to operate while earning a profit? Give your answer by those limits dragging the Qmin to...
The graph below shows the demand (D), marginal revenue (MR), marginal cost (MC), and average total...
 The graph below shows the demand (D), marginal revenue (MR), marginal cost (MC), and average total cost (ATC) curves for a hazardous-waste removal firm that operates as a local monopoly. If the market quantity is 400 barrels, use the area tool to draw the rectangle that represents the firm's profits. Your answer should be a rectangle drawn with four corners.
The graph shows a monopolist's demand (D), marginal revenue (MR), marginal cost (MC), and average total cost (ATC) curves. Despite having the market all to itself, the firm has struggled to make money. Suppose that the firm is sold, and the new owner is i
 The graph shows a monopolist's demand (D), marginal revenue (MR), marginal cost (MC), and average total cost (ATC) curves. Despite having the market all to itself, the firm has struggled to make money. Suppose that the firm is sold, and the new owner is initially less intent on maximizing profits than on simply making a profit. What range of production quantities will allow the firm to operate while earning a profit?Give your answer by dragging the Qmin to Qmax lines into their correct...
The graph below shows the demand (D), marginal revenue (MR), marginal cost (MC), and average total cost (ATC) curves for a supplier of bottled water to commercial buildings. The firm operates as a local monopoly. Use the area tool to draw the rectangle th
 The graph below shows the demand (D), marginal revenue (MR), marginal cost (MC), and average total cost (ATC) curves for a supplier of bottled water to commercial buildings. The firm operates as a local monopoly. Use the area tool to draw the rectangle that represents the firm's profit if the market quantity is 7,000 bottles.Your answer should be a rectangle with four corners. To refer to the graphing tutorial for this question type, please click here.
The graph shows the demand (D), marginal revenue (MR), and marginal cost (MC) curves for a...
 The graph shows the demand (D), marginal revenue (MR),
and marginal cost (MC) curves for a monopolist. Use the area tool
to outline the region corresponding to the deadweight loss that is
due to the market being monopolistic rather than competitive. Your
answer should be a triangle drawn with three corners.
Thank you.
The graph shows the demand (D), marginal revenue (MR), and marginal cost (MC curves for a monopolist. Use the area tool to outline the region corresponding to...
The graph shows the demand (D), marginal revenue (MR),
and marginal cost (MC) curves for a monopolist. Use the area tool
to outline the region corresponding to the deadweight loss that is
due to the market being monopolistic rather than competitive. Your
answer should be a triangle drawn with three corners.
Thank you.
The graph shows the demand (D), marginal revenue (MR), and marginal cost (MC curves for a monopolist. Use the area tool to outline the region corresponding to...
Hero Consider the graph of demand (D), average total cost (ATC), marginal revenue (MR), and marginal cost (MC) for...
 Hero Consider the graph of demand (D), average total cost (ATC), marginal revenue (MR), and marginal cost (MC) for a monopolistic firm. Assume no regulation is in place. Place box A on the graph to represent the profit or loss for the firm before regulation b. Now assume marginal cost pricing is imposed. Place box B on the graph to represent the profit or loss for the firm after marginal cost pricing is imposed. 678910111213141510 12 18 19 20 Market...
The graph to the right shows the Marginal Cost (MC), Average Total Cost (ATC), and Marginal...
 The graph to the right shows the Marginal Cost (MC), Average Total Cost (ATC), and Marginal Revenue (MR) curves for a perfectly (or purely) competitive firm. Note that the Demand (D) curve is the same as the MR curve for such a MR/MC ($) firm. Assume that the cost curves here are representative of other firms in the industry. Given the current price, this firm will: earn a positive profit. earn a negative profit. earn zero economic profit. In the...
The graph shows the Demand (D), Marginal Revenue (MR) and the Marginal Cost (MC) of a...
 The graph shows the Demand (D), Marginal Revenue (MR) and the Marginal Cost (MC) of a single-price, price searching firm. Drag the appropriate term to each of the colored areas A, B, C, D, E (Some terms may be used twice. For best results, drag the circle on the top left of the term to the center of the area.) Check
The following graph shows the marginal cost (MC), marginal revenue (MR), average total cost (ATC), and...
 The following graph shows the marginal cost (MC), marginal revenue (MR), average total cost (ATC), and demand (D) for a monopolist. Suppose that this monopolist cannot price discriminate. Place the grey point (starymbol) on the graph to indicate the profit-maximizing price and quantity for this monopolist. If the monopolist is making a profitne the green rectangle (triungle symbols) to shade in the area representing its profit. On the other hand, if the monopolist is suffering a loss use the purple...
 The graph shows a monopolist's demand (D), marginal revenue (MR), marginal cost (MC), and average total cost (ATC) curves. Despite having the market all to itself, the firm has struggled to make money. Suppose that the firm is sold,and the new owner is initially less intent on maximizing profits than on simply making a profit. What range of production quantities will low the frm to operate while earning a profit? Give your answer by those limits dragging the Qmin to...
 The graph below shows the demand (D), marginal revenue (MR), marginal cost (MC), and average total cost (ATC) curves for a hazardous-waste removal firm that operates as a local monopoly. If the market quantity is 400 barrels, use the area tool to draw the rectangle that represents the firm's profits. Your answer should be a rectangle drawn with four corners.
 The graph shows the demand (D), marginal revenue (MR),
and marginal cost (MC) curves for a monopolist. Use the area tool
to outline the region corresponding to the deadweight loss that is
due to the market being monopolistic rather than competitive. Your
answer should be a triangle drawn with three corners.
Thank you.
The graph shows the demand (D), marginal revenue (MR), and marginal cost (MC curves for a monopolist. Use the area tool to outline the region corresponding to...
The graph shows the demand (D), marginal revenue (MR),
and marginal cost (MC) curves for a monopolist. Use the area tool
to outline the region corresponding to the deadweight loss that is
due to the market being monopolistic rather than competitive. Your
answer should be a triangle drawn with three corners.
Thank you.
The graph shows the demand (D), marginal revenue (MR), and marginal cost (MC curves for a monopolist. Use the area tool to outline the region corresponding to...
 Hero Consider the graph of demand (D), average total cost (ATC), marginal revenue (MR), and marginal cost (MC) for a monopolistic firm. Assume no regulation is in place. Place box A on the graph to represent the profit or loss for the firm before regulation b. Now assume marginal cost pricing is imposed. Place box B on the graph to represent the profit or loss for the firm after marginal cost pricing is imposed. 678910111213141510 12 18 19 20 Market...
 The graph to the right shows the Marginal Cost (MC), Average Total Cost (ATC), and Marginal Revenue (MR) curves for a perfectly (or purely) competitive firm. Note that the Demand (D) curve is the same as the MR curve for such a MR/MC ($) firm. Assume that the cost curves here are representative of other firms in the industry. Given the current price, this firm will: earn a positive profit. earn a negative profit. earn zero economic profit. In the...
 The graph shows the Demand (D), Marginal Revenue (MR) and the Marginal Cost (MC) of a single-price, price searching firm. Drag the appropriate term to each of the colored areas A, B, C, D, E (Some terms may be used twice. For best results, drag the circle on the top left of the term to the center of the area.) Check
 The following graph shows the marginal cost (MC), marginal revenue (MR), average total cost (ATC), and demand (D) for a monopolist. Suppose that this monopolist cannot price discriminate. Place the grey point (starymbol) on the graph to indicate the profit-maximizing price and quantity for this monopolist. If the monopolist is making a profitne the green rectangle (triungle symbols) to shade in the area representing its profit. On the other hand, if the monopolist is suffering a loss use the purple...
Most questions answered within 3 hours.
-
A 357.7-gram sample of an unknown substance (MM = 92.41 g/mol)
is heated from -23.1 °C...
asked 6 minutes ago -
The capacitance in a series RCL circuit is C1 = 3.3 μF, and
the corresponding resonant...
asked 7 minutes ago -
The project aims to design a network for a casino. The casino
has 10 floors including...
asked 11 minutes ago -
Combustion of an unknown compound containing only carbon and
hydrogen produces 54.9 g of CO₂ and...
asked 27 minutes ago -
A basketball player achieves a hang time, the total time of
flight, of 0.748 s when...
asked 28 minutes ago -
A processor of carrots cuts the green top off each carrot,
washes the carrots, and inserts...
asked 39 minutes ago -
Please help me find the coefficient of kinetic and static
friction of two masses (500kg and...
asked 36 minutes ago -
Stanley Department Stores reported net income of $815,000 for
the year ended December 31, 2018.
Additional...
asked 41 minutes ago -
Below are the node_struct, link, list_struct and
list as defined in class and in hw3: typedef...
asked 39 minutes ago -
BA Corp is issuing a 10-year bond with a coupon rate of 6.00
percent. The interest...
asked 47 minutes ago -
How does a cell control the cell cycle? Explain 4 different ways
that cell cycle is...
asked 53 minutes ago -
We have to write some code to simulate
rabbits population growth in Australia. We have determined...
asked 53 minutes ago