1. The vertical distance between points A and B represents a tax in the market. What...
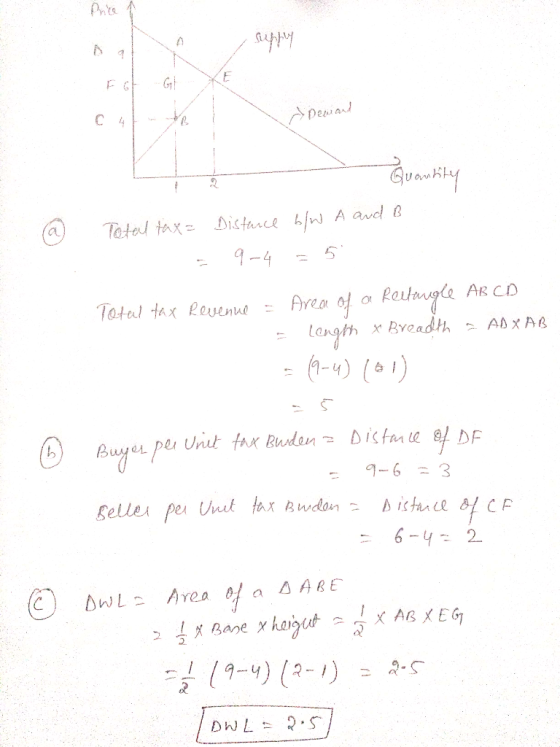
1. The vertical distance between points A and B represents a tax in the market.

- What is total tax?
- What are the buyers’ and sellers’ per-unit tax burden?
- How much deadweight loss (DWL) results from this tax?
Homework Answers
Add Answer to:
1. The vertical distance between points A and B represents a tax
in the market.
What...
Figure 2 The vertical distance between points A and B represents the tax in the market....
 Figure 2 The vertical distance between points A and B represents the tax in the market. Tarice 24 16 10 quantity 100 70 Question 12 2 pt Refer to Figure 2. The price that buyers pay after the tax is imposed is $10 $16 $24 O $18 Question 13 Refer to Figure 2. The effective price that sellers receive after the tax is imposed is $18 $16 $10 $24 Question 14 2 pts Refer to Figure 2. The amount of...
Figure 8-19 The vertical distance between points A and B represents the original tax 151 152...
 Figure 8-19 The vertical distance between points A and B represents the original tax 151 152 253 354 35 Refer to Figure 3.19. If the government changed the per unit tax from $5.00 to $2.50, then the price paid by buyers would be 57.50, the price received by sellers would be 55, and the quantity sold in the market would be 1.units. Compared to the original tax rate this lower tax rate would increase poverment revenue and increase the deadweight...
The vertical distance between points A and B represents the tax in the market. Supply 24...
 The vertical distance between points A and B represents the tax in the market. Supply 24 PRICE 16 Demand 70 100 QUANTITY Refer to Figure 6-10. The per-unit burden of the tax on buyers is O a. $8. O b. $6. O C. $14. O d. $24.
Using the graph shown, in which the vertical distance between points A and B represents the...
 Using the graph shown, in which the vertical distance between points A and B represents the tax in the market, answer the following questions. a. What was the equilibrium price and quantity in this market before the tax? b. What is the amount of the tax? c. How much of the tax will the buyers pay? d. How much of the tax will the sellers pay? e. How much will the buyer pay for the product after the tax is...
Figure 8-3 The vertical distance between points A and C represents a tax in the market....
 Figure 8-3
The vertical distance between points A and C represents a tax in
the market.
Refer to Figure 8-3. The price that buyers
effectively pay after the tax is imposed is
Group of answer choices
P3.
P1.
P4.
P2.
We were unable to transcribe this imagehome / study / business/ economics / economics questions and answers/ figure 8-3 the w Question: Figure 8-3 The vertical distance beti Figure 8-3 The vertical distance between points A and represents a...
Figure 8-3
The vertical distance between points A and C represents a tax in
the market.
Refer to Figure 8-3. The price that buyers
effectively pay after the tax is imposed is
Group of answer choices
P3.
P1.
P4.
P2.
We were unable to transcribe this imagehome / study / business/ economics / economics questions and answers/ figure 8-3 the w Question: Figure 8-3 The vertical distance beti Figure 8-3 The vertical distance between points A and represents a...
The vertical distance between points A and B represents a tax in the market. Price 15...
 The vertical distance between points A and B represents a tax in the market. Price 15 14 13 12t Supply 10 Demand s 10 15 20 25 30 35 40 4 50 35 60 65 70 75 80 8 uantity Refer to Figure 8-4. The price that buyers effectively pay after the tax is imposed is $12. between $8 and $12. between $5 and $8. S5 Previous Page Next Page
D Question 20 1 pts Figure 8-7 The vertical distance between points A and B represents...
 D Question 20 1 pts Figure 8-7 The vertical distance between points A and B represents a tax in the market. Price 24 Supply 20 18 l6 14 10 5 10 15 20 25 30 35 40 45 0 55 60 Danti Refer to Figure 8-7. Which of the following statements is correct? The loss of producer surplus that is associated with some sellers dropping out of the market as a result of the tax is $30. 。The loss of...
I need help solving this Asap. thanks alot. Figure 1: Supply and Demand in the Market...
 I need help solving this Asap. thanks alot.
Figure 1: Supply and Demand in the Market for a Good Price ($/unit) 35 27 Supply 23 19 15 13 11 9 Demand 5 13 17 Quantity (units) 11 12 10 8 6 14. Refer to Figure 1. At the market equilibrium, total consumer surplus is $10 b. $50 а. $100 d. $200 15. Refer to Figure 1. Holding the supply curve fixed, assume demand increased, which caused the equilibrium price to...
I need help solving this Asap. thanks alot.
Figure 1: Supply and Demand in the Market for a Good Price ($/unit) 35 27 Supply 23 19 15 13 11 9 Demand 5 13 17 Quantity (units) 11 12 10 8 6 14. Refer to Figure 1. At the market equilibrium, total consumer surplus is $10 b. $50 а. $100 d. $200 15. Refer to Figure 1. Holding the supply curve fixed, assume demand increased, which caused the equilibrium price to...
Figure 8-2 The vertical distance between points A and B represents a tax in the market....
 Figure 8-2 The vertical distance between points A and B represents a tax in the market. 1 Price + + + Supply + + + + + + + w + Demand 05 1 15 2 253 354 455 Quantity Refer to Figure 8-2. Total surplus without the tax is a $10, and total surplus with the tax is $2.50. b. $20, and total surplus with the tax is $7.50. C. $10, and total surplus with the tax is $7.50....
Please help with these questions.. thank you. Price ($/unit) Supply Demand OL 10 11 12 13 17 Quantity (units) 18. Re...
 Please help with these questions.. thank you.
Price ($/unit) Supply Demand OL 10 11 12 13 17 Quantity (units) 18. Refer to Figure 1. Suppose a tax of $6 per unit is imposed on sellers in this market. What is the total loss of consumer surplus resulting from this tax? a $18 b. $32 C. $36 d. $48 19. Refer to Figure 1. Suppose a tax of $6 per unit is imposed on sellers in this market. Which is correct?...
Please help with these questions.. thank you.
Price ($/unit) Supply Demand OL 10 11 12 13 17 Quantity (units) 18. Refer to Figure 1. Suppose a tax of $6 per unit is imposed on sellers in this market. What is the total loss of consumer surplus resulting from this tax? a $18 b. $32 C. $36 d. $48 19. Refer to Figure 1. Suppose a tax of $6 per unit is imposed on sellers in this market. Which is correct?...
 Figure 2 The vertical distance between points A and B represents the tax in the market. Tarice 24 16 10 quantity 100 70 Question 12 2 pt Refer to Figure 2. The price that buyers pay after the tax is imposed is $10 $16 $24 O $18 Question 13 Refer to Figure 2. The effective price that sellers receive after the tax is imposed is $18 $16 $10 $24 Question 14 2 pts Refer to Figure 2. The amount of...
 Figure 8-19 The vertical distance between points A and B represents the original tax 151 152 253 354 35 Refer to Figure 3.19. If the government changed the per unit tax from $5.00 to $2.50, then the price paid by buyers would be 57.50, the price received by sellers would be 55, and the quantity sold in the market would be 1.units. Compared to the original tax rate this lower tax rate would increase poverment revenue and increase the deadweight...
 The vertical distance between points A and B represents the tax in the market. Supply 24 PRICE 16 Demand 70 100 QUANTITY Refer to Figure 6-10. The per-unit burden of the tax on buyers is O a. $8. O b. $6. O C. $14. O d. $24.
 Using the graph shown, in which the vertical distance between points A and B represents the tax in the market, answer the following questions. a. What was the equilibrium price and quantity in this market before the tax? b. What is the amount of the tax? c. How much of the tax will the buyers pay? d. How much of the tax will the sellers pay? e. How much will the buyer pay for the product after the tax is...
 Figure 8-3
The vertical distance between points A and C represents a tax in
the market.
Refer to Figure 8-3. The price that buyers
effectively pay after the tax is imposed is
Group of answer choices
P3.
P1.
P4.
P2.
We were unable to transcribe this imagehome / study / business/ economics / economics questions and answers/ figure 8-3 the w Question: Figure 8-3 The vertical distance beti Figure 8-3 The vertical distance between points A and represents a...
Figure 8-3
The vertical distance between points A and C represents a tax in
the market.
Refer to Figure 8-3. The price that buyers
effectively pay after the tax is imposed is
Group of answer choices
P3.
P1.
P4.
P2.
We were unable to transcribe this imagehome / study / business/ economics / economics questions and answers/ figure 8-3 the w Question: Figure 8-3 The vertical distance beti Figure 8-3 The vertical distance between points A and represents a...
 The vertical distance between points A and B represents a tax in the market. Price 15 14 13 12t Supply 10 Demand s 10 15 20 25 30 35 40 4 50 35 60 65 70 75 80 8 uantity Refer to Figure 8-4. The price that buyers effectively pay after the tax is imposed is $12. between $8 and $12. between $5 and $8. S5 Previous Page Next Page
 D Question 20 1 pts Figure 8-7 The vertical distance between points A and B represents a tax in the market. Price 24 Supply 20 18 l6 14 10 5 10 15 20 25 30 35 40 45 0 55 60 Danti Refer to Figure 8-7. Which of the following statements is correct? The loss of producer surplus that is associated with some sellers dropping out of the market as a result of the tax is $30. 。The loss of...
 I need help solving this Asap. thanks alot.
Figure 1: Supply and Demand in the Market for a Good Price ($/unit) 35 27 Supply 23 19 15 13 11 9 Demand 5 13 17 Quantity (units) 11 12 10 8 6 14. Refer to Figure 1. At the market equilibrium, total consumer surplus is $10 b. $50 а. $100 d. $200 15. Refer to Figure 1. Holding the supply curve fixed, assume demand increased, which caused the equilibrium price to...
I need help solving this Asap. thanks alot.
Figure 1: Supply and Demand in the Market for a Good Price ($/unit) 35 27 Supply 23 19 15 13 11 9 Demand 5 13 17 Quantity (units) 11 12 10 8 6 14. Refer to Figure 1. At the market equilibrium, total consumer surplus is $10 b. $50 а. $100 d. $200 15. Refer to Figure 1. Holding the supply curve fixed, assume demand increased, which caused the equilibrium price to...
 Figure 8-2 The vertical distance between points A and B represents a tax in the market. 1 Price + + + Supply + + + + + + + w + Demand 05 1 15 2 253 354 455 Quantity Refer to Figure 8-2. Total surplus without the tax is a $10, and total surplus with the tax is $2.50. b. $20, and total surplus with the tax is $7.50. C. $10, and total surplus with the tax is $7.50....
 Please help with these questions.. thank you.
Price ($/unit) Supply Demand OL 10 11 12 13 17 Quantity (units) 18. Refer to Figure 1. Suppose a tax of $6 per unit is imposed on sellers in this market. What is the total loss of consumer surplus resulting from this tax? a $18 b. $32 C. $36 d. $48 19. Refer to Figure 1. Suppose a tax of $6 per unit is imposed on sellers in this market. Which is correct?...
Please help with these questions.. thank you.
Price ($/unit) Supply Demand OL 10 11 12 13 17 Quantity (units) 18. Refer to Figure 1. Suppose a tax of $6 per unit is imposed on sellers in this market. What is the total loss of consumer surplus resulting from this tax? a $18 b. $32 C. $36 d. $48 19. Refer to Figure 1. Suppose a tax of $6 per unit is imposed on sellers in this market. Which is correct?...
Most questions answered within 3 hours.
-
suppose there is a normally distributed population with a mean of
250 and a standard deviation...
asked 37 minutes ago -
Question Three
Suppose you as project manager are using the Waterfall
development methodology on a large...
asked 1 hour ago -
Which statement is not true about welfare in Canada?
A.Benefits typically vary based on one's ability...
asked 2 hours ago -
Please help me with FLOWCHART and UML diagram for class,
thank you!
#include <iostream>
#include <fstream>...
asked 2 hours ago -
3. Describe the “logic circuit” of the Lac operon. Which
proteins are bound or not to...
asked 2 hours ago -
Ayesha’s adjusted gross income is $60,000 in 2019. She donated a
piece of artwork with a...
asked 3 hours ago -
For Dijkstra’s shortest path algorithm:
a. Give the Big-O time for Dijkstra’s shortest path algorithm
and...
asked 3 hours ago -
Phosphorus violates the 'octet rule' in biological molecules,
forming more covalent bonds than expected based on...
asked 3 hours ago -
A 1.3 eV electron has a 10-4 probability of tunneling
through a 2.4 eV potential barrier....
asked 3 hours ago -
What is the one ingredient that is common to being successful
with all stakeholders?
profit
trust...
asked 3 hours ago -
Write an assembly language 32 bit program that reads in lines of
text by a .txt...
asked 3 hours ago -
what is the density ( in g/L) of hydrogen gas at 29 degrees C and a...
asked 3 hours ago