Using the data in the following table, 2. estimate the: a. Average return and volatility for...
Using the data in the following table, 2. estimate the:
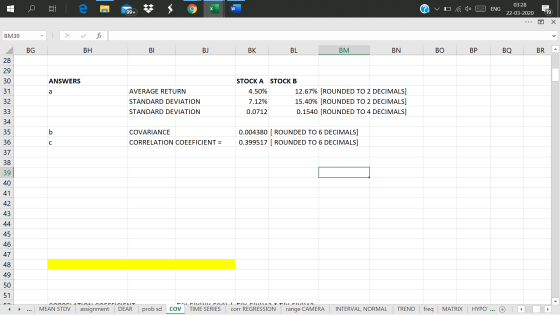
a. Average return and volatility for each stock.
b. Covariance between the stocks.
c. Correlation between these two stocks,
a. Estimate the average return and volatility for each stock.
The average return of stock A is _______ %. (Round to two decimal places.)
| Year | 2010 | 2011 | 2012 | 2013 | 2014 | 2015 |
|---|---|---|---|---|---|---|
| Stock A | -3% | 16% | 7% | -3% | 4% | 6% |
| Stock B | 16% | 19% | 28% | -1% | -11% | 25% |
Homework Answers
when i did this type of sum last time, standard deviation was asked in decimals and not %, so i have also mentioned that answer.
covarinace and correlation
asked in decimals upto 6 digits

Add Answer to:
Using the data in the following table, 2. estimate the: a. Average return and volatility for...
Using the data in the following table, estimate the:
Using the data in the following table, estimate the:a. Average return and volatility for each stock b. Correlation between these two stocks. c. The average return of stock A is %. Year201020112012201320142015Stock A-13%20%9%-6%1%10%Stock B21%33%45%-8%-7%33%
2. Using the data in the following table, estimate the average return and volatility for each...
2. Using the data in the following table, estimate the average return and volatility for each stock. Realized Returns Year Stock A Stock B 2008 4% 22% 2009 18% 25% 2010 8% 4% 2011 7% 10% 2012 3% 3% 2013 7%
Using the data in the following table, calculate: A. Average return and standard deviation for each...
Using the data in the following table, calculate: A. Average return and standard deviation for each stock B. Covariance between the stocks C. Correlation between the stocks D. Compute average return and standard deviation of the portfolio that maintains a 50% weight in Stock A and 50% in stock B Year 2010 2011 2012 2013 2014 2015 Stock A -10.0% 20.0% 5.0% -5.0% 2.0% 9.0% Stock B 21.0% 7.0% 30.0% -3.0% -8.0% 25.0%
1. Using the data in the following table, calculate: A. Average return and standard deviation for...
 1. Using the data in the following table, calculate: A. Average return and standard deviation for each stock (4 points) B. Covariance between the stocks (2 points) C. Correlation between the stocks (2 points) D. Compute average return and standard deviation of the portfolio that maintains a 50% weight in Stock A and 50% in stock B (2 points) Year 2010 2011 2012 2013 2014 2015 Stock A -10.0% 20.0% 5.0% -5.0% 2.0% 9.0% Stock B 21.0% 7.0% 30.0% -3.0%...
Please show working for all parts. 1. The annual returns of two stocks are given as...
 Please show working for all parts.
1. The annual returns of two stocks are given as follows. Year Stock A Stock B 2011 -10% 21% 2012 2013 20% 5% 7% 30% 2014 -5% -3% 2015 2% -8% 2016 9% 25% (a) Estimate the expected return and volatility of each stock. (b) Estimate the covariance and correlation between two stocks. (c) Find the expected returns and volatilities of portfolios that maintain 100.6% investment in Stock A and 100(1-x)% in Stock B,...
Please show working for all parts.
1. The annual returns of two stocks are given as follows. Year Stock A Stock B 2011 -10% 21% 2012 2013 20% 5% 7% 30% 2014 -5% -3% 2015 2% -8% 2016 9% 25% (a) Estimate the expected return and volatility of each stock. (b) Estimate the covariance and correlation between two stocks. (c) Find the expected returns and volatilities of portfolios that maintain 100.6% investment in Stock A and 100(1-x)% in Stock B,...
Using the data in the following table, and the fact that the correlation of A and...
 Using the data in the following table, and the fact that the correlation of A and B is 0.39, calculate the volatility (standard deviation) of a portfolio that is 70% invested in stock A and 30% invested in stock B. Realized Returns Year Stock A Stock B 2008 - 11% 16% 2009 12% 38% 2010 5% 3% 2011 -1% -8% 2012 3% - 13% 2013 34% The standard deviation of the portfolio is %. (Round to two decimal places.)
Consider the following information about 2 stocks: Year Stock Price Stock Price 2010 136.07 517.56 2011 138.97 525....
 Consider the following information about 2 stocks: Year Stock Price Stock Price 2010 136.07 517.56 2011 138.97 525.17 2012 139.57 515.05 2013 142.13 532.76 2014 140.26 540.12 2015 143.89 544.32 2016 144.07 527.05 2017 142.67 557.43 2018 145.46 558.09 Calculate: -expected return and standard deviation for stock A; -expected return and standard deviation for stock B; -correlation, covariance, and beta between stocks A and B; -portfolio return and standard deviation, assuming 40% is invested in stock A
Using the data in the following table, and the fact that the correlation of A and...
 Using the data in the following table, and the fact that the correlation of A and B is 0.35, calculate the volatility (standard deviation) of a portfolio that is 50% invested in stock A and 50% invested in stock B Realized Returns Year 2008 2009 2010 2011 2012 2013 Stock A -2% 10% 5% -4% 2% 7% Stock B 28% 26% 5% 18% The standard deviation of the portfolio is Џ96 (Round to two decimal places)
Using the data in the following table, and the fact that the correlation of A and...
 Using the data in the following table, and the fact that the correlation of A and B is 0.35 calculate the volatility standard deviation of a portfolio thatis 50% ınvested in stock A and 50% invested in stock B Realized Returns Year 2008 2009 2010 2011 2012 2013 Stock A -2% 10% 5% -4% 2% 7% Stock B 28% 26% 5% 1% 18% The standard deviation of the portfolio is「% (Round to two decimal places )
Using the data in the following table, and the fact that the correlation of A and...
 Using the data in the following table, and the fact that the correlation of A and B is 0.48, calculate the volatility standard deviation of a portfolio that is 70% invested in stock A and 30% invested in stock B Realized Returns Year 2008 2009 2010 2011 2012 2013 Stock A -10% 20% 5% -5% 2% 996 Stock B 21% 30% 7% -3% -8% 25% The standard deviation of the portfolio is 96. (Round to two decimal places.)
 1. Using the data in the following table, calculate: A. Average return and standard deviation for each stock (4 points) B. Covariance between the stocks (2 points) C. Correlation between the stocks (2 points) D. Compute average return and standard deviation of the portfolio that maintains a 50% weight in Stock A and 50% in stock B (2 points) Year 2010 2011 2012 2013 2014 2015 Stock A -10.0% 20.0% 5.0% -5.0% 2.0% 9.0% Stock B 21.0% 7.0% 30.0% -3.0%...
 Please show working for all parts.
1. The annual returns of two stocks are given as follows. Year Stock A Stock B 2011 -10% 21% 2012 2013 20% 5% 7% 30% 2014 -5% -3% 2015 2% -8% 2016 9% 25% (a) Estimate the expected return and volatility of each stock. (b) Estimate the covariance and correlation between two stocks. (c) Find the expected returns and volatilities of portfolios that maintain 100.6% investment in Stock A and 100(1-x)% in Stock B,...
Please show working for all parts.
1. The annual returns of two stocks are given as follows. Year Stock A Stock B 2011 -10% 21% 2012 2013 20% 5% 7% 30% 2014 -5% -3% 2015 2% -8% 2016 9% 25% (a) Estimate the expected return and volatility of each stock. (b) Estimate the covariance and correlation between two stocks. (c) Find the expected returns and volatilities of portfolios that maintain 100.6% investment in Stock A and 100(1-x)% in Stock B,...
 Using the data in the following table, and the fact that the correlation of A and B is 0.39, calculate the volatility (standard deviation) of a portfolio that is 70% invested in stock A and 30% invested in stock B. Realized Returns Year Stock A Stock B 2008 - 11% 16% 2009 12% 38% 2010 5% 3% 2011 -1% -8% 2012 3% - 13% 2013 34% The standard deviation of the portfolio is %. (Round to two decimal places.)
 Consider the following information about 2 stocks: Year Stock Price Stock Price 2010 136.07 517.56 2011 138.97 525.17 2012 139.57 515.05 2013 142.13 532.76 2014 140.26 540.12 2015 143.89 544.32 2016 144.07 527.05 2017 142.67 557.43 2018 145.46 558.09 Calculate: -expected return and standard deviation for stock A; -expected return and standard deviation for stock B; -correlation, covariance, and beta between stocks A and B; -portfolio return and standard deviation, assuming 40% is invested in stock A
 Using the data in the following table, and the fact that the correlation of A and B is 0.35, calculate the volatility (standard deviation) of a portfolio that is 50% invested in stock A and 50% invested in stock B Realized Returns Year 2008 2009 2010 2011 2012 2013 Stock A -2% 10% 5% -4% 2% 7% Stock B 28% 26% 5% 18% The standard deviation of the portfolio is Џ96 (Round to two decimal places)
 Using the data in the following table, and the fact that the correlation of A and B is 0.35 calculate the volatility standard deviation of a portfolio thatis 50% ınvested in stock A and 50% invested in stock B Realized Returns Year 2008 2009 2010 2011 2012 2013 Stock A -2% 10% 5% -4% 2% 7% Stock B 28% 26% 5% 1% 18% The standard deviation of the portfolio is「% (Round to two decimal places )
 Using the data in the following table, and the fact that the correlation of A and B is 0.48, calculate the volatility standard deviation of a portfolio that is 70% invested in stock A and 30% invested in stock B Realized Returns Year 2008 2009 2010 2011 2012 2013 Stock A -10% 20% 5% -5% 2% 996 Stock B 21% 30% 7% -3% -8% 25% The standard deviation of the portfolio is 96. (Round to two decimal places.)
Most questions answered within 3 hours.
-
Assume memory access is 10 units of time and disk access is
10000 units of time....
asked 5 minutes ago -
1. Are all good samples random?
2. Magazines often report surveys giving statistics such as “63%...
asked 27 minutes ago -
Under all the various types of market structures, firms
must eventually earn some economic profits for...
asked 13 minutes ago -
Consider the following fitness regime for a single locus trait
with two co-dominant alleles: w11 =...
asked 18 minutes ago -
A large cable company reports the following.
80% of its customers subscribe to its cable TV...
asked 33 minutes ago -
Please answer the question in brief.
Discuss the role of ERP in organizations. Are ERP tools...
asked 19 minutes ago -
Discuss the pros and cons of collaborative software such
as SameTime. Does it increase productivity? What...
asked 32 minutes ago -
Buying your in-laws a gift because it’s expected is
due to the ____________ motive of gift-giving....
asked 35 minutes ago -
Calculate the expected value, the variance, and the standard
deviation of the given random variable X....
asked 1 hour ago -
A hospital performs 100 surgeries per week. The probability that
complications after surgery occur is 10%....
asked 1 hour ago -
1 point) Given the significance level α=0.01 find the following:
(a) left-tailed z value z= (b)...
asked 1 hour ago -
Assuming you are the head of the software development unit at
Cyber.Soft, explain and justify why...
asked 42 minutes ago