
Homework Answers
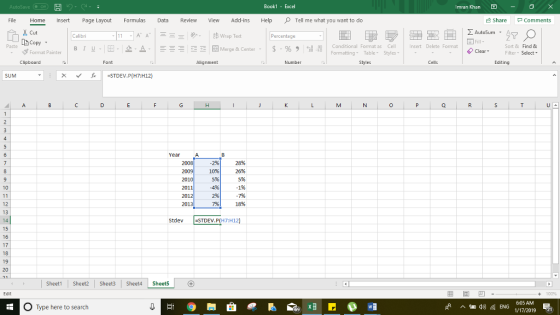
The standard deviation is calculated using excel:
| Year | A | B |
| 2008 | -2% | 28% |
| 2009 | 10% | 26% |
| 2010 | 5% | 5% |
| 2011 | -4% | -1% |
| 2012 | 2% | -7% |
| 2013 | 7% | 18% |
| Stdev | 4.90% | 13.33% |
Formula for 2 asset portfolio standard deviation:
Portfolio variance = w2A*σ2(RA) + w2B*σ2(RB) + 2*(wA)*(wB)*σ(RA)*σ2(RB)*Correlation(RA, RB)
Variance is standard deviation squared.
(0.50*4.90)^2+(0.50*13.33)^2+(2*0.50*0.50*4.90*13.33*0.35)
=Standard deviation=7.86%
Add Answer to:
Using the data in the following table, and the fact that the correlation of A and...
Using the data in the following table, and the fact that the correlation of A and...
 Using the data in the following table, and the fact that the correlation of A and B is 0.35 calculate the volatility standard deviation of a portfolio thatis 50% ınvested in stock A and 50% invested in stock B Realized Returns Year 2008 2009 2010 2011 2012 2013 Stock A -2% 10% 5% -4% 2% 7% Stock B 28% 26% 5% 1% 18% The standard deviation of the portfolio is「% (Round to two decimal places )
Using the data in the following table, and the fact that the correlation of A and...
 Using the data in the following table, and the fact that the correlation of A and B is 0.48, calculate the volatility standard deviation of a portfolio that is 70% invested in stock A and 30% invested in stock B Realized Returns Year 2008 2009 2010 2011 2012 2013 Stock A -10% 20% 5% -5% 2% 996 Stock B 21% 30% 7% -3% -8% 25% The standard deviation of the portfolio is 96. (Round to two decimal places.)
thanks! Using the data in the following table, and the fact that the correlation of A...
 thanks!
Using the data in the following table, and the fact that the correlation of A and B is 0.49, calculate the volatility (standard deviation) of a portfolio that is 70% invested in stock A and 30% invested in stock B. Realized Returns Year Stock A Stock B 2008 - 8% 20% 2009 10% 36% 2010 5% 2011 -9% 2012 5% 2013 10% 31% The standard deviation of the portfolio is %. (Round to two decimal places.)
thanks!
Using the data in the following table, and the fact that the correlation of A and B is 0.49, calculate the volatility (standard deviation) of a portfolio that is 70% invested in stock A and 30% invested in stock B. Realized Returns Year Stock A Stock B 2008 - 8% 20% 2009 10% 36% 2010 5% 2011 -9% 2012 5% 2013 10% 31% The standard deviation of the portfolio is %. (Round to two decimal places.)
Using the data in the following table, and the fact that the correlation of A and...
 Using the data in the following table, and the fact that the correlation of A and B is 0.39, calculate the volatility (standard deviation) of a portfolio that is 70% invested in stock A and 30% invested in stock B. Realized Returns Year Stock A Stock B 2008 - 11% 16% 2009 12% 38% 2010 5% 3% 2011 -1% -8% 2012 3% - 13% 2013 34% The standard deviation of the portfolio is %. (Round to two decimal places.)
50% invested in stock A and 50% invested in stock B. the following table, and the...
 50% invested in stock A and 50% invested in stock B. the following table, and the fact that the correlation of A and B is 0.47, calculate the volatility (standard deviation) of a portfolio that Using the data Realized Returns Stock B Stock A Year - 5 % 19% 2008 35% 8% 2009 7% 8% 2010 -9% -2% 2011 -14 % 2% 2012 27% 12% 2013 . (Round to two decimal places.) The standard deviation of the portfolio is
P 12-10 (similar to) Assigned Media Question Help Using the data in the following table, and...
 P 12-10 (similar to) Assigned Media Question Help Using the data in the following table, and the fact that the correlation of A and B is 0 27, calculate the volatility (standard deviation) of a portfolio that is 50% invested in stock A and 50% invested in stock B. Realized Returns Stock A Stock B -7% 29% 13% 13% - 2% - 11% 28% Year 2008 2009 2010 2011 2012 2013 31% - 10% P ma za The standard deviation...
2. Using the data in the following table, estimate the average return and volatility for each...
2. Using the data in the following table, estimate the average return and volatility for each stock. Realized Returns Year Stock A Stock B 2008 4% 22% 2009 18% 25% 2010 8% 4% 2011 7% 10% 2012 3% 3% 2013 7%
Find the STD of the portfolio and round to two decimal places 12 of 17 (8...
 Find the STD of the portfolio and round to two decimal places
12 of 17 (8 complete) HW Score: 37%, 37 of 100 pts Score: 0 of 3 pts P 12-10 (similar to) Assigned Media Question Help Using the data in the following table, and the fact that the correlation of A and B is 0.55, calculate the volatility (standard deviation) of a portfolio that is 50% invested in stock A and 50% invested in stock B the sprea Realized...
Find the STD of the portfolio and round to two decimal places
12 of 17 (8 complete) HW Score: 37%, 37 of 100 pts Score: 0 of 3 pts P 12-10 (similar to) Assigned Media Question Help Using the data in the following table, and the fact that the correlation of A and B is 0.55, calculate the volatility (standard deviation) of a portfolio that is 50% invested in stock A and 50% invested in stock B the sprea Realized...
Stock A Stock B 2005 -2 17 2006 20 21 2007 9 &
Stock A Stock B 2005 -2 17 2006 20 21 2007 9 2 2008 -1 -3 2009 4 -5 2010 12 24 Using the data in the following table, and the fact that the correlation of A and B is 0.53, calculate the volatility (standard deviation) of a portfolio that is 60% invested in stock A and 40% invested in stock B.
Stock A Stock B 2005 -1 20 2006 17 32 2007 10 2 2008 -10 ...
Stock A Stock B 2005 -1 20 2006 17 32 2007 10 2 2008 -10 -9 2009 3 -15 2010 12 26 Using the data in the following table, and the fact that the correlation of A and B is 0.64, calculate the volatility (standard deviation) of a portfolio that is 60% invested in stock A and 40% invested in stock B. Can you pls show me the steps so I can learn , Thankx
 Using the data in the following table, and the fact that the correlation of A and B is 0.35 calculate the volatility standard deviation of a portfolio thatis 50% ınvested in stock A and 50% invested in stock B Realized Returns Year 2008 2009 2010 2011 2012 2013 Stock A -2% 10% 5% -4% 2% 7% Stock B 28% 26% 5% 1% 18% The standard deviation of the portfolio is「% (Round to two decimal places )
 Using the data in the following table, and the fact that the correlation of A and B is 0.48, calculate the volatility standard deviation of a portfolio that is 70% invested in stock A and 30% invested in stock B Realized Returns Year 2008 2009 2010 2011 2012 2013 Stock A -10% 20% 5% -5% 2% 996 Stock B 21% 30% 7% -3% -8% 25% The standard deviation of the portfolio is 96. (Round to two decimal places.)
 thanks!
Using the data in the following table, and the fact that the correlation of A and B is 0.49, calculate the volatility (standard deviation) of a portfolio that is 70% invested in stock A and 30% invested in stock B. Realized Returns Year Stock A Stock B 2008 - 8% 20% 2009 10% 36% 2010 5% 2011 -9% 2012 5% 2013 10% 31% The standard deviation of the portfolio is %. (Round to two decimal places.)
thanks!
Using the data in the following table, and the fact that the correlation of A and B is 0.49, calculate the volatility (standard deviation) of a portfolio that is 70% invested in stock A and 30% invested in stock B. Realized Returns Year Stock A Stock B 2008 - 8% 20% 2009 10% 36% 2010 5% 2011 -9% 2012 5% 2013 10% 31% The standard deviation of the portfolio is %. (Round to two decimal places.)
 Using the data in the following table, and the fact that the correlation of A and B is 0.39, calculate the volatility (standard deviation) of a portfolio that is 70% invested in stock A and 30% invested in stock B. Realized Returns Year Stock A Stock B 2008 - 11% 16% 2009 12% 38% 2010 5% 3% 2011 -1% -8% 2012 3% - 13% 2013 34% The standard deviation of the portfolio is %. (Round to two decimal places.)
 50% invested in stock A and 50% invested in stock B. the following table, and the fact that the correlation of A and B is 0.47, calculate the volatility (standard deviation) of a portfolio that Using the data Realized Returns Stock B Stock A Year - 5 % 19% 2008 35% 8% 2009 7% 8% 2010 -9% -2% 2011 -14 % 2% 2012 27% 12% 2013 . (Round to two decimal places.) The standard deviation of the portfolio is
 P 12-10 (similar to) Assigned Media Question Help Using the data in the following table, and the fact that the correlation of A and B is 0 27, calculate the volatility (standard deviation) of a portfolio that is 50% invested in stock A and 50% invested in stock B. Realized Returns Stock A Stock B -7% 29% 13% 13% - 2% - 11% 28% Year 2008 2009 2010 2011 2012 2013 31% - 10% P ma za The standard deviation...
 Find the STD of the portfolio and round to two decimal places
12 of 17 (8 complete) HW Score: 37%, 37 of 100 pts Score: 0 of 3 pts P 12-10 (similar to) Assigned Media Question Help Using the data in the following table, and the fact that the correlation of A and B is 0.55, calculate the volatility (standard deviation) of a portfolio that is 50% invested in stock A and 50% invested in stock B the sprea Realized...
Find the STD of the portfolio and round to two decimal places
12 of 17 (8 complete) HW Score: 37%, 37 of 100 pts Score: 0 of 3 pts P 12-10 (similar to) Assigned Media Question Help Using the data in the following table, and the fact that the correlation of A and B is 0.55, calculate the volatility (standard deviation) of a portfolio that is 50% invested in stock A and 50% invested in stock B the sprea Realized...
Most questions answered within 3 hours.
-
1. When a nearsighted person looks at an object that is in the
distance with their...
asked 31 minutes ago -
QUESTION 8
Both of these statements will store the same value in the
variable $number
$number...
asked 55 minutes ago -
The price of 1 lb of potatoes is $1.75. If all the potatoes sold
today at...
asked 1 hour ago -
Garcia Company issues 20.00%, 15-year bonds with a par value of
$470,000 and semiannual interest payments....
asked 1 hour ago -
In C++ Programming, Try using loops only.
This lab demonstrates the use of the While Loop...
asked 2 hours ago -
Effect of DCMU and sodium azide on Chlamydomonas? We did an
experiment where we had Chlamydomonas...
asked 3 hours ago -
1a) According to the ideal gas law, _______________.
a. a gas has infinite volume at absolute...
asked 4 hours ago -
Oakdale Fashions, Inc. had $245,000 in 2018 taxable income.
Using the tax schedule in Table 2.3...
asked 5 hours ago -
The marketing class at CSUS had an average score of 150. An
educational analyst determined that...
asked 6 hours ago -
Justin Case has purchased a $250 000 home by putting 20 % down
and taking out...
asked 6 hours ago -
1. In a labor market, marginal cost for a firm is
____________.
a. recruiting cost
b....
asked 7 hours ago -
On January 1, 2019, ABC Company issued $60,000,000 of 20-year,
10.5% bonds when the market rate...
asked 7 hours ago