
Homework Answers


Add Answer to:
need done ASAP
Given the following cost function, determine the following cost functions TVC, ATC, AVC,...
Labor TVC TC MC AFC AVC ATC 25 50 75 100 25 125 (a) Complete...
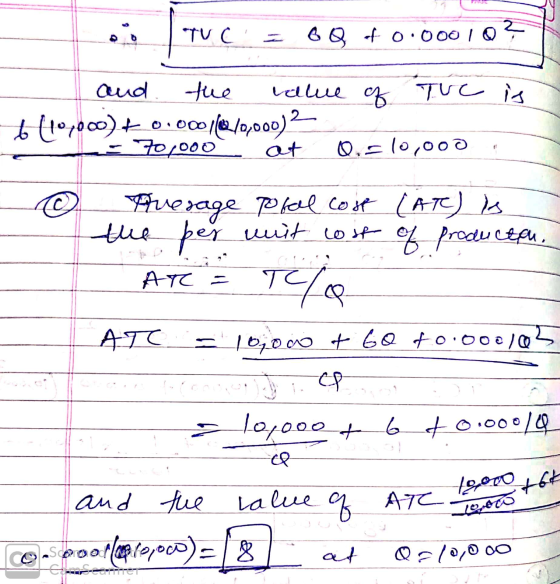
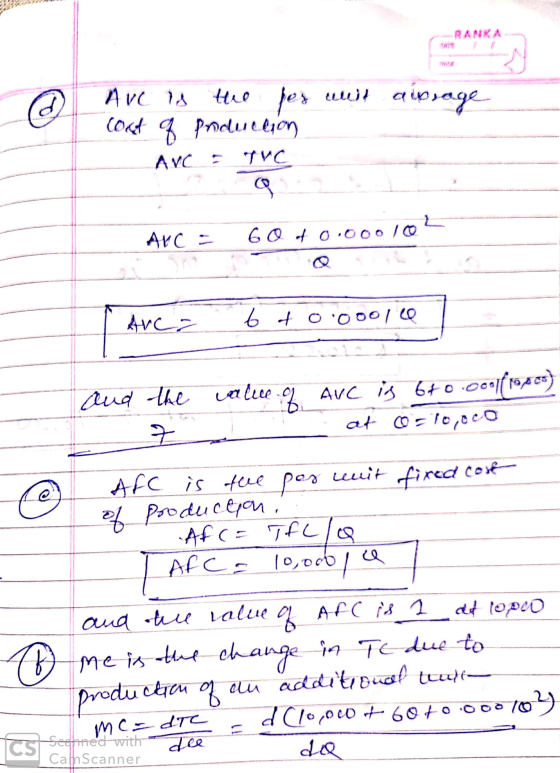
 Labor TVC TC MC AFC AVC ATC 25 50 75 100 25 125 (a) Complete the blank columns (5 points). Please create a table like mine and fill it. (b) Assume the price of this product equals $10. What's the profit-maximizing output (q)? (3 points). Note: managers maximize profits by setting MR=MC and under perfectly competitive markets, MR=Price. Thus, maximize profit by producing a where P=MC.(2 points) (c) What is the profit? (3 points) TOTAL COST (TC) - the...
Find FC, VC, TC, AFC, AVC, ATC, and MC from the following table. Capital costs $50 per unit, and two units of capital a...
 Find FC, VC, TC, AFC, AVC, ATC, and MC from the following table. Capital costs $50 per unit, and two units of capital are used in the short run. Labor costs $20 per unit. 7. Total Cost Average Average Marginal Variable Cost |(MC) Fixed Units of Units of Variable Average Fixed Labor (L) Cost (FC) Cost (VC) (TC) Total Cost Output (ATC) (Q) Cost Cost (AFC) (AVC) 0 0 1 2 2 4 3 6 4 8 10
MC TVC AFC AVC ATC TC Output TFC $500 $200 1 2 $800 $75 $875 $925...
 MC TVC AFC AVC ATC TC Output TFC $500 $200 1 2 $800 $75 $875 $925 $75 100 Refer to an above table. What is the average variable cost of producing three units of the output? $291.67 o $125 $100 $166.67 问题3 29 问题3 AVC ATC MC AFC Output TVC TC TFC $500 $200 $800 2 $75 $875 4 $925 5 100 $75 Which of the following is correct for this firm with the cost structure presented in the table...
Calculate A) Total Fixed Cost (TFC), Total Variable Cost (TVC), Average Fixed Cost (AFC), Average Variable...
Calculate A) Total Fixed Cost (TFC), Total Variable Cost (TVC), Average Fixed Cost (AFC), Average Variable Cost (AVC), Average Total Cost (ATC), and Marginal Cost (MC). B) Graph the average fixed cost (AFC), average variable cost (AVC), average total cost (ATC), and the marginal cost (MC) curves on one graph and TFC curve, TVC cost curve, and TC curve on another graph. Quantity Produced Total Cost 0 $ 120 1 135 2 148 3 159 ...
pogu u (a) Calculate the fixed cost (FC), average fixed cost (AFC), average variable cost (AVC),...
 pogu u (a) Calculate the fixed cost (FC), average fixed cost (AFC), average variable cost (AVC), average total cost (ATC) and marginal cost (MC) from the table below. Units of output Total cost AFC ATC FC 50 AVC 0 0 MC 0 0 80 128 180 280 405 (b) Draw graphs to plot these cost curves against output. (c) Explain what these shapes tell us about returns and efficiency.
D Question 7 1 pts Use the following graph that shows the marginal cost (MC) curve,...
 D Question 7 1 pts Use the following graph that shows the marginal cost (MC) curve, the Average Variable Cost (AVC) curve, and the Average Total Cost (ATC) curve. What is the variable cost when the quantity (Q) being produced is 6? P MC ATC /AVC $15 $11 $8 Q O $66 $8 O $15 $11 Question 8 1 pts Use the following graph that shows the marginal cost (MC) curve, the Average Variable Cost (AVC) curve, and the Average...
Describe the shape of AFC(average fixed cost), AVC(Average Variable cost), ATC(Average total cost) and MC(Marginal cost)...
Describe the shape of AFC(average fixed cost), AVC(Average Variable cost), ATC(Average total cost) and MC(Marginal cost) Explain graphic relationship among ATC, AVC and MC. I would be appreciated if the answered in 5senteces,
Use the graph below to fill in the blanks. ATC МС AVC 15 14 11 10...
 Use the graph below to fill in the blanks. ATC МС AVC 15 14 11 10 Quantity 150 250 0 $ 1 If output is 150 units, then average total cost (ATC) 2 If output is 150 units, then average variable cost (AVC) S $ If output is 150 units, then average fixed cost (AFC) 3. $ If output is 150 units, then total cost (TC) 4. If output is 150 units, then total variable cost (TVC) S 5. 6,...
Question 11 1 pts Refer to the table below that shows Output, FC, VC, TC, AVC,...
 Question 11 1 pts Refer to the table below that shows Output, FC, VC, TC, AVC, ATC, and MC. What is the value of X? OUTPUT(Q) FC VC TC AVC ATC MC 10 200 400 х 11 662 Y 12 82 N $40 $600 $6000 $60 Question 10 1 pts Use the following graph that shows the marginal cost (MC) curve, the Average Variable Cost (AVC) curve, and the Average Total Cost (ATC) curve. What is the fixed cost when...
nk spaces of this table. Note that Q, VC. TC, AFC. AVC. ATC. an o output,...
 nk spaces of this table. Note that Q, VC. TC, AFC. AVC. ATC. an o output, variable cost, total cost, average fixed cost, average the blank of total cost, and marginal cost, respectively. (10 Points) AFC TAVG 50 n/a n/a n/a n/a 10 10 10 60 30 80 30 6.67 20 36.67 100 150 12.5 37.5 150 30 8.3535 43.33 60 b Please graph the ATC, FC, MC curve respectively (5 Points) c What is shape of ATC and can...
 Labor TVC TC MC AFC AVC ATC 25 50 75 100 25 125 (a) Complete the blank columns (5 points). Please create a table like mine and fill it. (b) Assume the price of this product equals $10. What's the profit-maximizing output (q)? (3 points). Note: managers maximize profits by setting MR=MC and under perfectly competitive markets, MR=Price. Thus, maximize profit by producing a where P=MC.(2 points) (c) What is the profit? (3 points) TOTAL COST (TC) - the...
 Find FC, VC, TC, AFC, AVC, ATC, and MC from the following table. Capital costs $50 per unit, and two units of capital are used in the short run. Labor costs $20 per unit. 7. Total Cost Average Average Marginal Variable Cost |(MC) Fixed Units of Units of Variable Average Fixed Labor (L) Cost (FC) Cost (VC) (TC) Total Cost Output (ATC) (Q) Cost Cost (AFC) (AVC) 0 0 1 2 2 4 3 6 4 8 10
 MC TVC AFC AVC ATC TC Output TFC $500 $200 1 2 $800 $75 $875 $925 $75 100 Refer to an above table. What is the average variable cost of producing three units of the output? $291.67 o $125 $100 $166.67 问题3 29 问题3 AVC ATC MC AFC Output TVC TC TFC $500 $200 $800 2 $75 $875 4 $925 5 100 $75 Which of the following is correct for this firm with the cost structure presented in the table...
 pogu u (a) Calculate the fixed cost (FC), average fixed cost (AFC), average variable cost (AVC), average total cost (ATC) and marginal cost (MC) from the table below. Units of output Total cost AFC ATC FC 50 AVC 0 0 MC 0 0 80 128 180 280 405 (b) Draw graphs to plot these cost curves against output. (c) Explain what these shapes tell us about returns and efficiency.
 D Question 7 1 pts Use the following graph that shows the marginal cost (MC) curve, the Average Variable Cost (AVC) curve, and the Average Total Cost (ATC) curve. What is the variable cost when the quantity (Q) being produced is 6? P MC ATC /AVC $15 $11 $8 Q O $66 $8 O $15 $11 Question 8 1 pts Use the following graph that shows the marginal cost (MC) curve, the Average Variable Cost (AVC) curve, and the Average...
 Use the graph below to fill in the blanks. ATC МС AVC 15 14 11 10 Quantity 150 250 0 $ 1 If output is 150 units, then average total cost (ATC) 2 If output is 150 units, then average variable cost (AVC) S $ If output is 150 units, then average fixed cost (AFC) 3. $ If output is 150 units, then total cost (TC) 4. If output is 150 units, then total variable cost (TVC) S 5. 6,...
 Question 11 1 pts Refer to the table below that shows Output, FC, VC, TC, AVC, ATC, and MC. What is the value of X? OUTPUT(Q) FC VC TC AVC ATC MC 10 200 400 х 11 662 Y 12 82 N $40 $600 $6000 $60 Question 10 1 pts Use the following graph that shows the marginal cost (MC) curve, the Average Variable Cost (AVC) curve, and the Average Total Cost (ATC) curve. What is the fixed cost when...
 nk spaces of this table. Note that Q, VC. TC, AFC. AVC. ATC. an o output, variable cost, total cost, average fixed cost, average the blank of total cost, and marginal cost, respectively. (10 Points) AFC TAVG 50 n/a n/a n/a n/a 10 10 10 60 30 80 30 6.67 20 36.67 100 150 12.5 37.5 150 30 8.3535 43.33 60 b Please graph the ATC, FC, MC curve respectively (5 Points) c What is shape of ATC and can...
Most questions answered within 3 hours.
-
if a firm producing 100 units at $5.00 each experience
an 80% experience curve, what will...
asked 18 minutes ago -
A solid, uniform disk of radius 0.250 m and mass 53.7 kg rolls
down a ramp...
asked 2 hours ago -
Given the following table of high speed internet access vs.
annual home income:
Home Income
%...
asked 3 hours ago -
A baseball batter hits a 0.145kg baseball straight up into the
air. The baseball leaves the...
asked 3 hours ago -
An FM modulator is tested using
single-tone baseband signal with frequency of 50kHz and a sprectrum...
asked 3 hours ago -
Write the ionic equations for the first stage of salts
hydrolysis.
Anion, Cation?
Na2S
NiSO4
K2SO4...
asked 5 hours ago -
suppose there is a normally distributed population with a mean of
250 and a standard deviation...
asked 6 hours ago -
Question Three
Suppose you as project manager are using the Waterfall
development methodology on a large...
asked 7 hours ago -
Which statement is not true about welfare in Canada?
A.Benefits typically vary based on one's ability...
asked 7 hours ago -
Please help me with FLOWCHART and UML diagram for class,
thank you!
#include <iostream>
#include <fstream>...
asked 8 hours ago -
3. Describe the “logic circuit” of the Lac operon. Which
proteins are bound or not to...
asked 8 hours ago -
Ayesha’s adjusted gross income is $60,000 in 2019. She donated a
piece of artwork with a...
asked 8 hours ago