
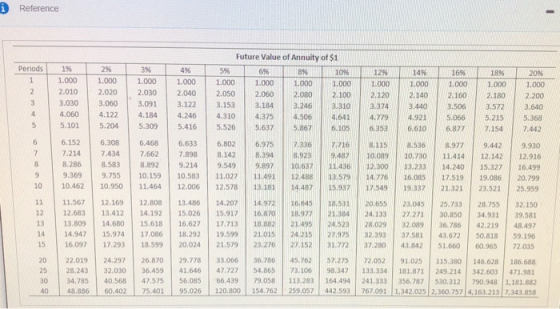


iReference Future Value of Annuity of $1 Periods 1% 2% 3% 6 % 4% 8 % 59% 10 % 12 % 16 % 14% 18% 20% 1.000 1.000 1.000 1.000 1.000 1.000 1.000 1000 1000 1.000 1.000 1.000 1,000 2 2.010 2.020 2.030 2.040 2.050 2.060 2.080 2.100 2.120 2.140 2.160 2.180 2.200 3 3.030 3.060 3.091 3.122 3.153 3.184 3.246 3.310 3.374 3.440 3.506 3.572 3.640 4 4,060 4.122 4.184 4.246 4.310 4.375 4.506 4.641 4.779 4.921 5.066 5.215 5.368 5.101 5.204 5.309 5.416 5.526 5.637 5.867 6.105 6.353 6.610 6,877 7.154 7.442 6 6.152 6.308 6.468 6.633 6.802 6.975 7.336 7.716 8.115 8.536 8.977 9.442 9.930 7 7.214 7,434 7.662 7.898 8.142 8.394 8.923 9.487 10.089 10.730 11.414 12.142 12.916 8.286 8.583 8.892 9.214 9.549 9.897 10.637 11.436) 12.300 13.233 14.240 15.327 16.499 9 9.369 9.755 10.159 10.583 11.027 11.491 12.488 13.579 14.776 16.085 17.519 19.086 20.799 10 10.462 10.950 11.464 12.578 13.181 12.006 14.487 15.937 17.549 19.337 21.321 23.521 25.959 11 11.567 13.486 14.972 12.169 12.808 14.207 18.531 16.645 20.655 23.045 25.733 28.755 32.150 12 12.683 13.412 14.192 16.870 18.882 15.026 15.917 18.977 21.384 24.133 27.271 30.850 34.931 39.581 13 13.809 14.680 15.618 16.627 17.713 21.495 24.523 28.029 32.089 36.786 42.219 48.497 14 14.947 15.974 17.086 18.292 19.599 21.015 24.215 27.975 32.393 37.581 43.672 50.818 59.196 15 16.097 17.293 18.599 20.024 21.579 23.276 27.152 31.772 37.280 43.842 51.660 60.965 72.035 20 33.066 36.786 22.019 24.297 26.870 29.778 45.762 57.275 72.052 186.688 91.025 115.380 146.628 25 47.727 54.865 73.106 98.347 28.243 32.030 36.459 41.646 133.334 181.871 249.214 342.603 471.981 30 34.785 40.568 47.575 56.085 66.439 79.058 113.283 164.494 356,787 241.333 530.312 790.948 1,181.882 767.091 1.342.025 2,360.757 4.163.213 7,343.858 40 48.886 60.402 75.401 95.026 120.800 154.762 259.057 442.593
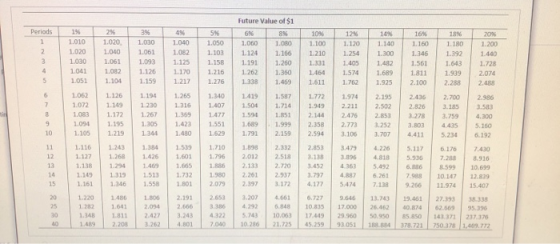
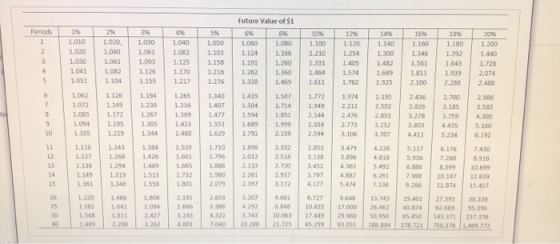
Future Value of $1 3 % Periods 4 % 1% 2% 5 % 10 % 18 % 6% 8% 12% 14% 16 % 20% 1.010 1.020 1.030 1.040 1.050 1.060 1.080 1.100 1.120 1.140 1.180 1.160 1.200 1.020 1.040 1.061 1.082 1.103 1.124 1.166 1.210 1.254 1.300 1.346 1.392 1.440 1030 1.061 1.093 1.125 1.158 1.191 1.260 1.331 1.405 1.482 1.561 1.643 1.728 4 1.041 1.082 1.126 1.170 1.216 1.262 1.360 1.464 1.574 1.689 1.811 1.939 2.074 5 1.051 1.104 1.159 1.217 1.276 1,338 1.469 1.611 1.762 1.925 2.100 2.288 2.488 1.062 1.126 1194 1.265 1.340 1.419 1.587 1.772 1.974 2.195 2.436 2.700 2.986 7 1.072 1.149 1.230 1.316 1.407 1.504 1.714 1.949 2.502 2.211 2.826 3.185 3.583 tini 1.083 1.172 1.267 1.369 1.477 1.591 1.851 2.144 2476 2.853 3.278 3.759 4.300 1.094 1.195 1.305 1.423 1.551 1.689 1.999 2.358 2.773 3.252 3.803 4,435 5.160 10 1.105 1.215 1.344 2.159 1.480 1.629 1.791 2.594 3.106 3.707 4.411 5.234 6.192 11 1.116 1.243 1.384 1.539 1.710 1.898 2.332 2.853 3.479 4.226 5.117 6.176 7.430 12 2.012 2.518 3.138 1.127 1.268 1.426 1.601 1.796 3.896 4.818 5.936 7.288 8.916 2.133 13 1.138 1.294 1.469 1.665 1.886 2.720 3.452 4.361 5.492 6.886 8.599 10.699 1.732 2.261 2.937 14 1.149 1319 1513 1.980 3.797 4.887 6.261 7.988 10.147 12.829 2.397 3.172 15 1.161 1.346 1.558 1.801 2.079 4.177 5.474 7.138 9.266 11.974 15.407 1.220 2.191 3.207 20 1.486 L806 2.653 4.661 6.727 9.646 13.743 19.461 27.393 38.338 25 1.282 1.641 2,094 2.666 3.386 4.292 6.848 10.835 17.000 26.462 40.874 62.669 95.390 30 1,348 1.811 2.427 3.243 4.322 5,743 10.063 17.449 85.850 29.960 50.950 237.376 750.378 1,469.772 143 371 40 1.489 2.208 7,040 10.286 21.725 3.262 4.801 45.259 93.051 188.884 378.721
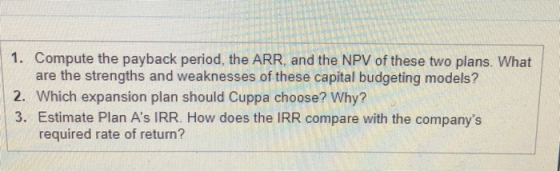
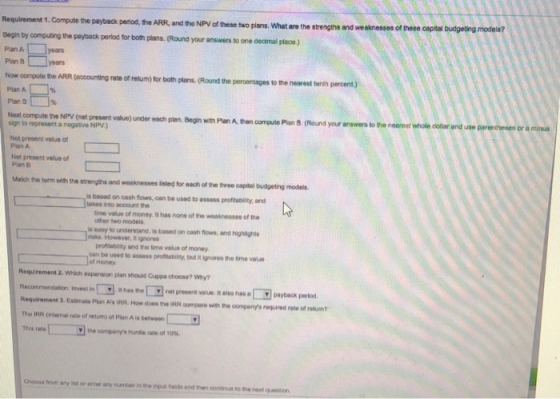
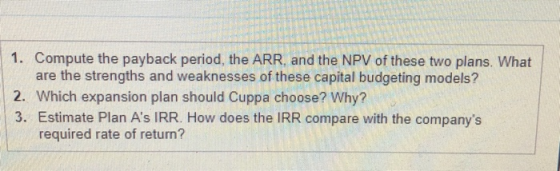
1. Compute the payback period, the ARR, and the NPV of these two plans. What are the strengths and weaknesses of these capital budgeting models? 2. Which expansion plan should Cuppa choose? Why? 3. Estimate Plan A's IRR. How does the IRR compare with the company's required rate of return?
FI2028 (S al 8 Queston Hepe C Cuppa Inc operates a chain of lunch shops The company is considering two possible expareion plans Plan A would open eight smaller shops at a cost of 58.940,000 Expeced aneual net cash inows are 51.550,000wth z residual vale at the end of ten years. Under Plan B, Cuppa would open three langer shops at a cost of 58.840,000 This plan is expected to generate net cash ino of $1,100,000 per year for on years, the estiated Me of the properties Estimated reaidal value is 5950,000 Cuppa uses straight ine depreciation and requires an annual reban of 10 % (Cick the icon to view the present value annuity factor table) (Click the lcen to view the present value factor table (Cick the koon to view the future vald factor table) Cick the icon to view the Suture value annuily faclor table) Read the teguitements
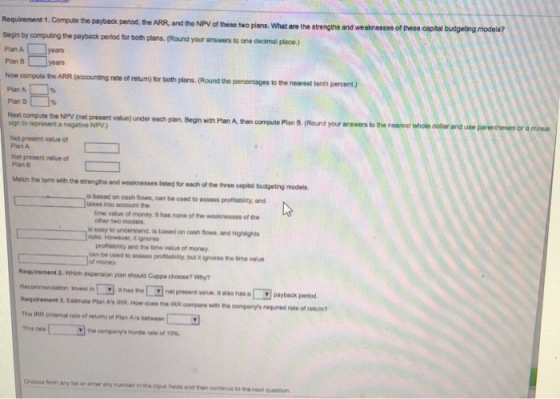
Requirement 1. Compute the payback period, the ARR, and the NPV of these tao plans. What are the strengths and weaknesses of these capital budgeting models? Begin by computing the payback period for both plans. (Round your answers to one decimal place) years Plan A years Plan B Now compute the ARR (accounting rate of retum) for both plans. (Round the peroentages to the nearest Senth percent) % Plan A % Plen D Next compute the NPV (net present value) under each plan. Begin with Plan A, then compute Plan 8. (Round your answers to the nearest whole dollar and use parentheses or a minusi sign to represent a negative NPV) Net present value of Pian A Nat present velue of Plan B Match the term with the strengths and wesknesses isted for each of the three capital budgeting models is basod on cash fows, can be used to assoss profitabilty, and takes into ac0ount the time value of money It has none of the weaknesses of the other two models is easy to understand, is based on cash flows, and highlights rgks However, it ignores proftablity and the time value of money can be used to assoss profitability, but it ignores the time value of money Requirement 2. Which expension plan should Cuppa choose? Why? Recommendation: Invest in has the nat present vaiue. It also has e Ypayback period Requirement 3. Estimate Plan A's RR How does he iRR compare with the company's required rale of reum The IRR (ntamal rale of retum) of Plan A is betweon This rate the company's hurdie rate of 10% Choose from any ist or enter any number in the input fids and then continue to the next question
Cuppa Inc. operates a chain of lunch shops. The company is considering two possible expansion plans. Plan A would open eight smaller shops at a cost of $8,940,000. Expected annual net cash inflows are $1,550,000 with zero residual value at the end of ten years Under Plan B, Cuppa would open three larger shops at a cost of $8,840,000. This plan is expected to generate net cash inflows of $1,100,000 per year for ten years, the estimated life of the properties. Estimated residual value is 50 Cuppa uses straight-line depreciation and requires an annual return of 10 %. (Click the icon to view the present value annuity factor table.) (Click the icon to view the present value factor table.) (Click the icon to view the future value annuity factor table) (Click the icon to view the future value factor table.) Read the tequirements Requirement 1. Compute the payback period, the ARR, id the NPV of these two plans. What are the strengths and weaknesses of these capital budgeting models? Begin by computing the payback period for both plans (Round your answers to one decimal place) Plan A 5.8 years Plan B 8.0 years torrect: 0 Now compute the ARR (accounting rate of return) for both plans. (Round the percentages to the nearest fenth percent.) Plan A % Plan B %
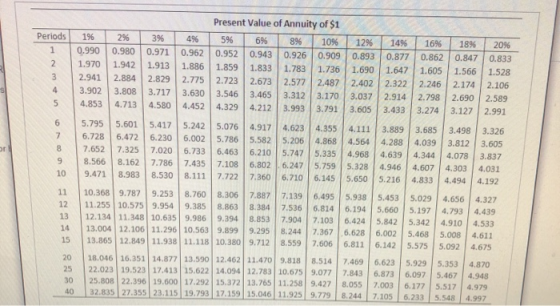
Present Value of Annuity of $1 Periods 19% 2% 3% 49%6 5% 6% 8% 10% 12% 14% 16% 18% 20% 1 0.990 0.980 0.971 0.962 0.952 0.943 0.926 0.909 0.893 0.877 0.862 0.847 0.833 1.970 1.942 1.913 1.886 1.859 1.833 1.783 1.736 1.690 1.647 1.605 1.566 1.528 3 2.941 2.884 2.829 2.775 2.723 2.673 2.577 2.402 2.487 2.322 2.246 2.174 2.106 4 3.902 3.808 3.717 3.630 3.546 3.465 3.312 3.170 3.037 2.914 2.798 2.690 2.589 5 4.853 4.713 4.580 4.452 4.329 4.212 3.993 3.791 3.605 3.433 3.274 3.127 2.991 6 5.795 5.601 5.417 5.242 5.076 4.917 4.623 4.355 4.111 3.889 3.685 3.498 3.326 7 6.728 6.472 6.230 6.002 5.786 5.582 5.206 4.868 4.564 4.288 4.039 3.812 3.605 or l 8 7.652 7.325 7.020 6.733 6.463 6.210 5.747 5.335 4.968 4.639 4.344 4.078 3.837 9 8.566 8.162 7.786 7.435 7.108 6.802 6.247 5.759 5.328 4.946 4.607 4.303 4.031 10 9.471 8.983 8.530 8.111 7.722 7.360 6.710 6.145 5.650 5.216 4.833 4.494 4.192 11 10.368 9.787 9.253 8.760 8.306 7.887 7.139 6.495 5.938 5.453 5.029 4.656 4.327 12 10.575 9.954 12.134 11.348 10.635 11.255 9.385 8.863 8.384 7.536 6.814 6.194 5.660 5.197 4.793 4,439 13 9.986 9.394 8.853 7.904 7.103 6.424 5.842 5.342 4.910 4.533 13.004 12.106 11.296 10.563 14 9.899 9.295 8.244 7.367 6.628 6.002 5.468 5.008 4.611 13.865 12.849 11.938 11.118 10.380 9.712 15 8.559 7.606 6.811 6.142 5.575 5.092 4.675 18.046 16.351 14.877 13.590 12.462 11.470 9.818 8.514 20 7.469 6.623 5.929 5.353 4.870 22.023 19.523 17.41315.622 14.094 12.783 10.675 9.077 25 7.843 6.873 6.097 5.467 4.948 25.808 22.396 19.600 17.292 15.372 13.765 11.258 9.427 30 8.055 7.003 6.177 5.517 4.979 32.835 27.355 23.115 19.793 17.159 15.046 11.925 9.779 40 8.244 7.105 6.233 5.548 4.997 un
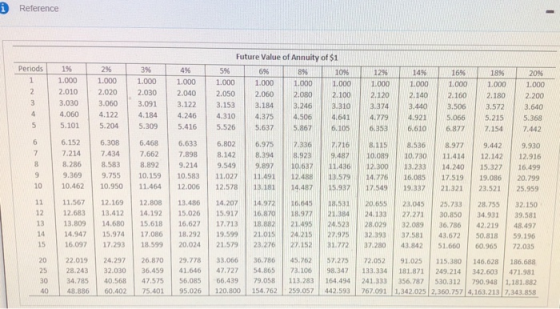
Reference Future Value of Annuity of $1 Periods 1% 2% 3% 6 % 4% 8 % 5% 10 % 14 % 16 % 12% 18% 20% 1.000 1.000 1.000 1.000 1.000 1.000 1.000 1.000 1.000 1.000 1.000 1.000 1,000 2 2.010 2.020 2.030 2.040 2.050 2.060 2.080 2.100 2.120 2.140 2.160 2.180 2.200 3,030 3 3.060 3.091 3.122 3.153 3.184 3.246 3.310 3.374 3.440 3.506 3.640 3.572 4 4,060 4.122 4.184 4.246 4.310 4.375 4.506 4.641 4.779 4.921 5.066 5.215 5.368 5.101 5.204 5.309 5.416 5.526 5.637 5.867 6.105 7.442 6.353 6.610 6,877 7.154 6 6.152 6.308 6.468 6.633 6.802 6.975 7.336 7.716 8.115 8.536 8.977 9.442 9.930 7 7.214 7.434 7.662 7.898 8.142 8.394 8.923 9.487 10.089 10.730 11.414 12.142 12.916 8.286 8.583 8.892 9.214 9.549 9.897 10.637 11.436) 12.300 13.233 14.240 15.327 16.499 9 9.369 9.755 10.159 10.583 11.027 11.491 12.488 13.579 14.776 16.085 17.519 19.086 20.799 10 10.462 10.950 11.464 12.578 13.181 12.006 14.487 15.937 17.549 19.337 21.321 23.521 25.959 11 11.567 13.486 12.169 12.808 14.207 14.972 16.645 18.531 20.655 23.045 25.733 28.755 32.150 12 12.683 13.412 14.192 16.870 18.882 15.026 15.917 18.977 21.384 24.133 27.271 30.850 34.931 39.581 13 13.809 14.680 15.618 16.627 17.713 21.495 24.523 28.029 32.089 36.786 42.219 48.497 14 14.947 15.974 17.086 18.292 19.599 21.015 24.215 27.975 32.393 37.581 43.672 50.818 59.196 15 16.097 17.293 18.599 20.024 21.579 23.276 27.152 31.772 37.280 43.842 51.660 60.965 72.035 33.06 36.786 20 22.019 24.297 26.870 29.778 45.762 57.275 72.052 186.688 91.025 115.380 146.628 25 41.646 47.727 54.865 73.106 28.243 32.030 36.459 98.347 133.334 181.871 249.214 342.603 471.981 30 34.785 40.568 47.575 56.085 66.439 79.058 113.283 164.494 356.787 241.333 530.312 790.948 1,181.882 767.091 1.342.025 2,360.757 4,163.213 7,343.858 40 48.886 60.402 75.401 95.026 120.800 154.762 259.057 442.593 I
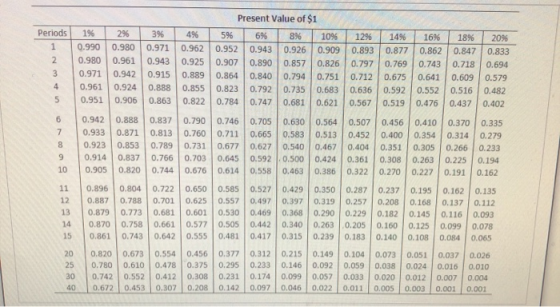
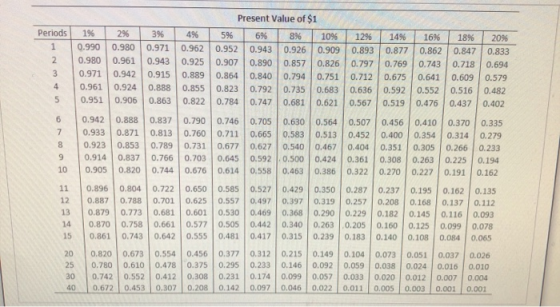
Present Value of $1 Periods 19% 2% 3% 4%6 5% 6% 10 % 8% 12% 16 % 14% 18% 20% 1 0.990 0.980 0.971 0.962 0.952 0.943 0.909 0.926 0.893 0.877 0.862 0.847 0.833 2 0.980 0.961 0.943 0.925 0.907 0.890 0.857 0.826 0.797 0.769 0.743 0.718 0.694 3 0.971 0.942 0.915 0.889 0.864 0.840 0.794 0.712 0.751 0.675 0.641 0.579 0.609 4 0.961 0.924 0.888 0.855 0.823 0.792 0.735 0.683 0.636 0.592 0.552 0.516 0.482 5 0.951 0.906 0.863 0.822 0.784 0.747 0.681 0.621 0.567 0.519 0.476 0.437 0.402 0.942 0.888 0.837 0.790 0.746 0.705 0.630 0.564 0.507 0.456 0.410 0.370 0.335 7 0.933 0.871 0.813 0.760 0.711 0.583 0.665 0.513 0.452 0.400 0.354 0.314 0.279 8 0.923 0.853 0.789 0.731 0.467 0.677 0.627 0.404 0.540 0.351 0.266 0.305 0.233 0.914 0.837 0.766 , 0.500 0.703 0.645 0.592 0.424 0.361 0.308 0.263 0.225 0.194 10 0.905 0.820 0.744 0.676 0.614 0.558 0.463 0.386 0.322 0.270 0.227 0.191 0.162 11 0.896 0.804 0.722 0.650 0.585 0.527 0.429 0.350 0.287 0.237 0.195 0.162 0.135 12 0.887 0.788 0.701 0.625 0.557 0.497 0.397 0.319 0.257 0.208 0.168 0.137 0.112 13 0.879 0.773 0.681 0.601 0.530 0.469 0.368 0.290 0.229 0.182 0.145 0.116 0.093 14 0.870 0.758 0.661 0.577 0.505 0.442 0.340 0.263 0.205 0.160 0.125 0.099 0.078 15 0.861 0.743 0.642 0.555 0.481 0.417 0.315 0.239 0.183 0.140 0.108 0.084 0.065 20 0.820 0.673 0.554 0.377 0.312 0.215 0.456 0.149 0.104 0.073 0.051 0.037 0,026 25 0.295 0.233 0.780 0.610 0.478 0.375 0.146 0.092 0.059 0.038 0.024 0.016 0.010 30 0.742 0.552 0.412 0.308 0.231 0.174 0.099 0.057 0.033 0.020 0.012 0.007 0.004 40 0.672 0.453 0.307 0.208 0.142 0.097 0.046 0.022 0.011 0.005 0.003 0.001 0.001 on
Future Value of $1 3 % Periods 1% 4 % 2% 5 % 6 % 8% 10% 12% 14% 16 % 18% 20% 1.010 1.020 1.030 1.040 1.050 1,060 1.080 1.100 1.120 1.140 1.180 1.160 1.200 2. 1.020 1.040 1.061 1.082 1.103 1.124 1.166 1.210 1.254 1.300 1.346 1.392 1.440 1030 1.061 1.093 1.125 1.158 1.191 1.260 1.331 1.482 1.405 1.561 1.643 1.728 4 1.126 1.041 1.082 1.170 1.216 1.262 1.360 1,464 1,574 1.689 1.811 1.939 2.074 5 1.051 1.104 1.159 1.217 1.276 1,338 1.469 1.611 1.762 1.925 2.100 2.288 2.488 1.062 1.126 1.194 1.265 1.340 1.419 1.587 1.772 1.974 2.195 2.436 2.700 2.986 1.072 1.149 1.230 1.316 1.407 1.504 1.714 1.949 2.502 2.211 2.826 3.185 3.583 tin 1.083 1.172 1.267 1.369 1.477 1.591 1.851 2.144 2476 2.853 3.278 3.759 4.300 1.094 1.195 1.305 1.423 1.551 1.689 1.999 2.358 2.773 3.252 3.803 4.435 5.160 10 1.105 1.219 1.344 1.480 1.629 1.791 2.159 2.594 3.106 3.707 4.411 5.234 6.192 2.332 11 1.116 1.243 1.384 1.539 1.710 1.898 3.479 2.853 4.226 5.117 6.176 7.430 12 2.012 2.518 1.127 1.268 1.426 1.601 1.796 3.138 3.896 4.818 5.936 7.288 8.916 2.133 13 1.138 1.294 1.469 1.665 1,886 2.720 3.452 4.363 5.492 6.886 8.599 10.699 2.261 2.937 14 1.149 1319 1513 1.732 1.980 3.797 4887 6.261 7.988 10.147 12.829 2.397 3.172 15 1.161 1.346 1.558 1.801 2.079 4.177 5.474 7.138 9.266 11.974 15.407 1806 2.191 2.653 3.207 20 1.220 1.486 4.661 6.727 9.646 13.743 19.461 27.393 38.338 25 a0 1.282 1.641 2,094 2.666 3.386 4.292 6.848 10.835 17.000 26.462 40.874 62.669 95.396 1.348 1.811 2.427 3.243 4.322 5.743 10.063 17.449 85.850 29.960 50.950 237.376 143371 750.378 1,469.772 40 1.489 2.208 4.801 7.040 10.286 21.725 3.262 45.259 93.051 188.884 378,721
1. Compute the payback period, the ARR, and the NPV of these two plans. What are the strengths and weaknesses of these capital budgeting models? 2. Which expansion plan should Cuppa choose? Why? 3. Estimate Plan A's IRR. How does the IRR compare with the company's required rate of return?
Requirement 1. Compute the payback period, the ARR, and the NPV of these tao plans. What are the strengths and weaknesses of these capital budgeting models? Begin by computing the payback pariod for both plans. (Round your answers to one decimal place) years Plan A years Plan B Now compute the ARR (accounting rate of retum) for both plans. (Round the peroentages to the nearest tenth percent.) % Plan A % Plen D Next compute the NPV (net present value) under each plan. Begin with Plan A then compute Plan B. (Round your answers to the nearest whole dollar and use parentheses or a minusi sign to represent a negative NPV) Net present value of Pian A Net present velue of Plan B Match the term with the strengths and wesknesses isted for each of the three capital budgeting models is based on cash fows, can be used to assoss profitabity, and takes into account the time value of money It has none of the weaknesses of the other two models is easy to understand, is based on cash flows, and highlights rks However, it ignores proftablity and the time value of money can be used to assess proftabilty but it ignores the time value of money Requirement 2. Which expension plan should Cuppa choose? Why? Recommendation Invest in has the nat present vaiue. It also has a payback period. Requirement 3. Estimale Plan A's RR How does the iRR compare with the company's required rate of reum The IRR (ntamal rale of retum) of Plan A ls between This rate the company's hurdie rate of 10% Choose from any ist or enter any number in the input aids and then continue to the nex queon
Homework Answers
Plan A
Investment = $8940000
Life = 10 years
Depreciation = (Original Value - Salvage Value) / Useful Life
= $8940000 / 10 = $894000
Expected Annual Net Cash Inflows = $1550000
Accounting Income = Net Cash flow - Depreciation
= $1550000 - $894000 = $656000
Payback Period = Investment / Annual Net cash inflows
= $8940000 / $1550000 = 5.77 years
Accounting Rate of Return = Accounting Income / Investment x
100
= $696000 / $8940000 x 100 = 7.79%
NPV = Annual Net cash inflows x PV annuity at required rate -
Investment
PV annuity @10% for 10 years = 6.1446
NPV = $1550000 x 6.1446 - $8940000 = $584130
Plan B
Investment = $8840000, Residual Value = $950000
Life = 10 years
Depreciation = (Original Value - Salvage Value) / Useful Life
= ($8840000 - $950000) / 10 = $789000
Expected Annual Net Cash Inflows = $1100000
Accounting Income = Net Cash flow - Depreciation
= $1100000 - $789000 = $311000
Payback Period = Investment / Annual Net cash inflows
= $8840000 / $1100000 = 8.04 years
Accounting Rate of Return = Accounting Income / Investment x
100
= $311000 / $8840000 x 100 = 3.52%
NPV = Annual Net cash inflows x PV annuity at required rate +
Salvage Value x PV factor - Investment
PV annuity @10% for 10 years = 6.1446, PV factor for 10th year @10%
= 0.3855
NPV = $1100000 x 6.1446 + $950000 x 0.3855 - $8840000 =
($1714715)
2.
Cuppa should choose Plan A, as it provides positive NPV, better
than Plan B, better payback period and better ARR than Plan B.
3. Plan A IRR
At IRR, NPV is zero, therefore we set NPV at zero and try at
different rates to arrive at solution
Lets try rate of 12%
PV annuity @12% for 10 years = 5.6502
NPV = $1550000 x 5.6502 - $8940000 = ($182190)
NPV @ 10% = $584130 (as calculated above)
IRR = 10% + ($584130 -
0) x (12 - 10)
($584130 + $182190)
= 10% + 0.75 x 2 = 11.50%
IRR gives Internal rate of return that the project provides.
whereas Required rate of return is the rate of return that the
project provides. If the IRR is equal to or greater than Required
rate of return,the project is accepted.
In the given case also IRR i,e, 11.67% is greater than required
rate of return of 10%
Add Answer to:
Present Value of Annuity of $1 Periods 19% 2% 3% 49%6 5% 6% 8% 10% 12%...
(Click the icon to view Present Value of $1 table.) Lulus Company operates a chain of sandwich shops. (Click the icon t...
 (Click the icon to view Present Value of $1 table.) Lulus Company operates a chain of sandwich shops. (Click the icon to view additional information.) C Read the requirements. (Click the icon to view Present Value of Ordinary Annuity of $1 table.) (Click the icon to view Future Value of $1 table.) C (Click the icon to view Future Value of Ordinary Annuity of $1 table.) Requirement 1. Compute the payback, the ARR, the NPV, and the profitability index of...
present value of $1 table future value of $1 table let me know ASAP if this...
 present value of $1 table
future value of $1 table
let me know ASAP if this is the information you were needing
please !
More Info Lados Company operates a chain of sandwich shops Click the icon to view additional information) (Cd Read the requirements (Cid (Cic id The company is considering two possible expansion plans. Plan A would open eight smaller shops at a cost of $8.400,000. Expected annual net cash inflows are $1,500,000 for 10 years, with zero...
present value of $1 table
future value of $1 table
let me know ASAP if this is the information you were needing
please !
More Info Lados Company operates a chain of sandwich shops Click the icon to view additional information) (Cd Read the requirements (Cid (Cic id The company is considering two possible expansion plans. Plan A would open eight smaller shops at a cost of $8.400,000. Expected annual net cash inflows are $1,500,000 for 10 years, with zero...
Lapos operates a chain of sandwich shops. The company is considering two possible expansion plans. Plan...
Lapos operates a chain of sandwich shops. The company is considering two possible expansion plans. Plan A would open 8 smaller shops at a cost of $8,400,000. Expected annual net cash inflows are $1,550,000 with 0 residual value at the end of 10 years. Under plan B, Lapos would open 3 shops at a cost of $ 8,250,000. This plan is expected to generate net cash inflows of $1,080,000 per year for 10 years, the estimated useful life of the...
Question 1. A. B. Future Value of $1 Periods 4% 1.040 1.082 5% 6% 7% 8%...
 Question 1.
A. B.
Future Value of $1 Periods 4% 1.040 1.082 5% 6% 7% 8% 9% 10% 12% 14% 16% 1.060 1.124 1.070 1.140 1,300 1 1.050 1.103 1.158 1.080 1.090 1.100 1.210 1.120 1.254 1.160 2 1.145 1.166 1.188 1.346 1.191 1.405 3 1.125 1.170 1.225 1.311 1,403 1.260 1,295 1.331 1.464 1,482 1.561 1.811 2.100 1.689 1.925 4 1.216 1.262 1.360 1.412 1.574 1.338 1,539 5 1.217 1.276 1.469 1,611 1.762 1.772 1.949 1.265 1.316 2.195 2.502...
Question 1.
A. B.
Future Value of $1 Periods 4% 1.040 1.082 5% 6% 7% 8% 9% 10% 12% 14% 16% 1.060 1.124 1.070 1.140 1,300 1 1.050 1.103 1.158 1.080 1.090 1.100 1.210 1.120 1.254 1.160 2 1.145 1.166 1.188 1.346 1.191 1.405 3 1.125 1.170 1.225 1.311 1,403 1.260 1,295 1.331 1.464 1,482 1.561 1.811 2.100 1.689 1.925 4 1.216 1.262 1.360 1.412 1.574 1.338 1,539 5 1.217 1.276 1.469 1,611 1.762 1.772 1.949 1.265 1.316 2.195 2.502...
P26-31A (similar to) Lolas Company operates a chain of sandwich shops. i (Click the icon to...
 P26-31A (similar to) Lolas Company operates a chain of sandwich shops. i (Click the icon to view additional information.) (Click the icon to view Present Value of $1 table.) (Click the icon to view Present Value of Ordinary Annuity of $1 table.) (Click the icon to view Future Value of $1 table.) (Click the icon to view Future Value of Ordinary Annuity of $1 table.) Read the requirements Requirement 1. Compute the payback, the ARR, the NPV, and the profitability...
Present Value of an Annuity of 1 Periods 8% 9% 10% 1  
Present Value of an Annuity of 1 Periods 8% 9% 10% 1 .926 .917 .909 2 1.783 1.759 1.736 3 2.577 2.531 2.487 A company has a minimum required rate of return of 9%. It is considering investing in a project that costs $210,000 and is expected to generate cash inflows of $84,000 at the end of each year for three years. The net present value of this project is Group of answer choices $212,604. $42,000. $21,261. $2,604.
1 More Info Requirement 1. Compute the payback, the ARR, the NPV, and the profitability index...
 1 More Info Requirement 1. Compute the payback, the ARR, the NPV, and the profitability index of these two plans Calculate the payback for both plans. (Round your answers to one decimal place, XX) Amount invested Expected not cash flow Plan 5450000 1525000 Plan B 8150000 11100000 . The company is considering the possible o n Pan would ghtmarshops at a cost of $8.450 000 E u o 51525.000 for 10 year with ori e nd of years. Under Pan...
Present Value of an Annuity of 1 Periods 8% 9% 10% 1 0.926 0.917 0.909 2...
Present Value of an Annuity of 1 Periods 8% 9% 10% 1 0.926 0.917 0.909 2 1.783 1.759 1.736 3 2.577 2.531 2.487 A company has a minimum required rate of return of 9%. It is considering investing in a project that costs $219000 and is expected to generate cash inflows of $88000 at the end of each year for three years. The net present value of this project is $222728. $44000. $22273. $3728.
Splash City is considering purchasing a water park in Atlanta, Georgia, for $1,910,000. The new facility...
Splash City is considering purchasing a water park in Atlanta, Georgia, for $1,910,000. The new facility will generate annual net cash inflows of $472,000 for eight years. Engineers estimate that the facility will remain useful for eight years and have no residual value. The company uses straight-line depreciation, and its stockholders demand an annual return of 10% on investments of this nature. Requirement 1. Compute the payback, the ARR, the NPV, the IRR, and the profitability index of this investment....
 (Click the icon to view Present Value of $1 table.) Lulus Company operates a chain of sandwich shops. (Click the icon to view additional information.) C Read the requirements. (Click the icon to view Present Value of Ordinary Annuity of $1 table.) (Click the icon to view Future Value of $1 table.) C (Click the icon to view Future Value of Ordinary Annuity of $1 table.) Requirement 1. Compute the payback, the ARR, the NPV, and the profitability index of...
 present value of $1 table
future value of $1 table
let me know ASAP if this is the information you were needing
please !
More Info Lados Company operates a chain of sandwich shops Click the icon to view additional information) (Cd Read the requirements (Cid (Cic id The company is considering two possible expansion plans. Plan A would open eight smaller shops at a cost of $8.400,000. Expected annual net cash inflows are $1,500,000 for 10 years, with zero...
present value of $1 table
future value of $1 table
let me know ASAP if this is the information you were needing
please !
More Info Lados Company operates a chain of sandwich shops Click the icon to view additional information) (Cd Read the requirements (Cid (Cic id The company is considering two possible expansion plans. Plan A would open eight smaller shops at a cost of $8.400,000. Expected annual net cash inflows are $1,500,000 for 10 years, with zero...
 Question 1.
A. B.
Future Value of $1 Periods 4% 1.040 1.082 5% 6% 7% 8% 9% 10% 12% 14% 16% 1.060 1.124 1.070 1.140 1,300 1 1.050 1.103 1.158 1.080 1.090 1.100 1.210 1.120 1.254 1.160 2 1.145 1.166 1.188 1.346 1.191 1.405 3 1.125 1.170 1.225 1.311 1,403 1.260 1,295 1.331 1.464 1,482 1.561 1.811 2.100 1.689 1.925 4 1.216 1.262 1.360 1.412 1.574 1.338 1,539 5 1.217 1.276 1.469 1,611 1.762 1.772 1.949 1.265 1.316 2.195 2.502...
Question 1.
A. B.
Future Value of $1 Periods 4% 1.040 1.082 5% 6% 7% 8% 9% 10% 12% 14% 16% 1.060 1.124 1.070 1.140 1,300 1 1.050 1.103 1.158 1.080 1.090 1.100 1.210 1.120 1.254 1.160 2 1.145 1.166 1.188 1.346 1.191 1.405 3 1.125 1.170 1.225 1.311 1,403 1.260 1,295 1.331 1.464 1,482 1.561 1.811 2.100 1.689 1.925 4 1.216 1.262 1.360 1.412 1.574 1.338 1,539 5 1.217 1.276 1.469 1,611 1.762 1.772 1.949 1.265 1.316 2.195 2.502...
 P26-31A (similar to) Lolas Company operates a chain of sandwich shops. i (Click the icon to view additional information.) (Click the icon to view Present Value of $1 table.) (Click the icon to view Present Value of Ordinary Annuity of $1 table.) (Click the icon to view Future Value of $1 table.) (Click the icon to view Future Value of Ordinary Annuity of $1 table.) Read the requirements Requirement 1. Compute the payback, the ARR, the NPV, and the profitability...
 1 More Info Requirement 1. Compute the payback, the ARR, the NPV, and the profitability index of these two plans Calculate the payback for both plans. (Round your answers to one decimal place, XX) Amount invested Expected not cash flow Plan 5450000 1525000 Plan B 8150000 11100000 . The company is considering the possible o n Pan would ghtmarshops at a cost of $8.450 000 E u o 51525.000 for 10 year with ori e nd of years. Under Pan...
Most questions answered within 3 hours.
-
O’Deesha Company has the following information available:
Quality engineering of
products
$20,000
Quality training of
employees &n
asked 1 minute ago -
a) Draw two water molecules.
b) Clearly name and label the type of bond that exists...
asked 1 hour ago -
C - Language
Write a loop that sets each array element to the sum of itself...
asked 2 hours ago -
(63
#14)
which of the following statments best describes how chamging
the concentration of the substances...
asked 5 hours ago -
In the following reaction, which element is undergoing
oxidation: Na2SO3 + N2O --> N2 + Na2SO4...
asked 6 hours ago -
Which of the following pairs of ions have the same electron
configuration?
I: Br− and Se2−...
asked 9 hours ago -
The Foremost Composite Materials Company is planning a two-day
sales conference for October 19-20. The conference...
asked 9 hours ago -
3) Illustrate the observed pattern of relatedness of organisms
versus adaptations to specific conditions. This means...
asked 9 hours ago -
In winter a lake has a 0.35 m thick ice layer over 1.10 m of
water....
asked 10 hours ago -
Assuming the following has been encrypted with a Vigenere cipher
below, use the method(s) and assumptions...
asked 11 hours ago -
How would I use switch statements to write a program that will
take an input of...
asked 11 hours ago -
Imagine a reaction in which methane gas combusts at a constant
pressure of 1 atm and...
asked 11 hours ago