


2. Interprets the directional of the relationship of each statistically significant independent variable with respect to the preference for the hybrid model concerned.
relative importance of each of the stalisticu idependent variables. 4. Assesses the strength of the statistically significant independent variables as they join to predict the preferences for the hybrid model concerned. Coefficients Model Unstandardized Coefficients Sig Standardized Coefficients t Std. Error Beta 6.981 13.795 .000 506 3.694E-007 .001 000 101 3.383 -1.315 098 -531 -13.442 000 339 115 086 2.953 ,003 5 026 004 260 6.220 .000 -.219 042 -291 5.207 .000 .000 3.073E-006 .075 1.920 .055 .119 039 .164 3.016 .003 a. Dependent Variable: Desirability: 1 Seat Motorcycle Electric
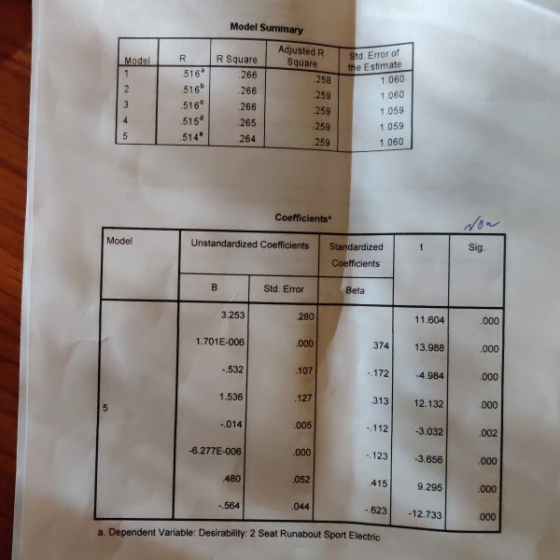
Model Summary Adjusted R Square Std Error of the Estimate 1.060 R Square R Model .516 .516b 1 266 258 266 259 1.060 3 516e 266 259 1.059 515 265 259 1.059 5 514 264 259 1.060 Coefficients Model Unstandardized Coefficients Standardized Sig. Coefficients Std. Error Beta 3.253 .280 11.604 .000 1.701E-006 .000 374 13.988 000 -.532 107 ..172 4.984 .000 1.536 .127 313 12.132 .000 5 -.014 .005 .112 -3.032 .002 -6.277E-006 .000 .123 -3.656 ,000 480 .052 .415 9.295 .000 -.564 .044 -623 -12.733 000 a. Dependent Variable: Desirability: 2 Seat Runabout Sport Electric
Model Summary Adjusted R Square Std Error of the Estimate 1.172 R Square R Model 425 652 418 1 .652 .652 651d 425 1.171 419 2 425 1.171 419 424 1.171 419 4 .650 1.172 422 418 Sig. Standardized Model Unstandardized Coefficients Coefficients Std. Error Beta 3.080 .002 2.073 .673 000 000 -7.911E-007 140 -5.611 -1.479 ,126 -384 -11.768 .000 318 ,174 052 ,067 1.830 .057 -.147 -074 -2.572 010 3 -.096 005 619 -17.725 ,000 465 061 396 7.591 000 -1.137E-005 000 -178 -5.503 .000 -441 .068 306 -6.520 .000 657 056 583 11.710 .000 a. Dependent Variable: Desirability: 2 Seat Runabout Hatchback Gasoline Hybrid 8( Sya
Model Summary Adjusted R Square Std Error of the Estimate 1.257 R Square R Model 500 .707 .707 707 494 500 495 1.257 2 499 495 1.256 3 Coefficients Sig. Unstandardized Coefficients Standardized Model Coefficients Std. Error E Beta .000 4.049 1.222 302 .000 .175 -5.905 -7.532E-007 .000 015 2.439 094 275 113 .003 2.948 086 131 .044 5 .000 465 11.050 055 005 .001 -6.185E-006 -.128 -3.463 .000 080 -087 044 -1.993 047 .120 .032 .152 3.770 .000 a. Dependent Variable: Desirability: 5 Seat Economy Gasoline Model Summary Adjusted R Square Std. Error of the Estimate R Square Model 507 258 249 1.259 1 .507b 507 258 250 1.258 2 258 3 251 1.257 5074 257 251 4 1.257 505* 255 250 5 1.258 병보보명송
Homework Answers
The sign of beta coefficient tells the directional of the relationship of statistically significant independent variables. Positive sign suggests a direct relationship between the independent and dependent variable and negative sign depicts an inverse relationship.
The strength of the model should be judged on the basis adjusted R square since the problem statement involves including multiple variables. As we keep on adding more independent variables, R square certainly increases but adjusted R square stops increasing at one point due to the division by the number of covariates. Hence, the model with maximum adjusted R square is the most suitable model.
Add Answer to:
With each hybrid automobile model, prepare a summary that does the following: 2. Interprets the directional...
With each hybrid automobile model, prepare a summary that does the following: 2. Interprets the directional...
 With each hybrid automobile model, prepare a summary that does the following: 2. Interprets the directional of the relationship of each statistically significant independent variable with respect to the preference for the hybrid model concerned. Independent variables as they join to predict the preferences for the hybrid model concerned Coefficients Model Unstandardized Coefficients Standardized Sig Coefficients B Std. Error Beta 6.981 506 13.795 .000 3.694E-007 000 3.383 101 ,001 -1.315 098 -13.442 -.531 000 -.339 115 -.086 -2.953 ,003 5...
15.2 Spssx output With each hybrid automobile model, prepare a summary that does the following: 2....
 15.2 Spssx output With each hybrid automobile model, prepare a summary that does the following: 2. Interprets the directional of the relationship of each statistically significant independent variable with respect to the preference for the hybrid model concerned. Coefficients Sig Model Unstandardized Coefficients t Standardized Coefficients Std. Error Beta 000 13.795 6.981 506 3.694E-007 3.383 001 101 .000 -1.315 .098 .531 -13.442 .000 339 -115 .086 -2.953 .003 5 -.026 .004 -260 -6.220 .000 -219 042 -291 -5.207 000 3.073E-006...
Model Summary Adjusted R Square Std. Error of the Estimate Model R R Square 1 .843a...
 Model Summary Adjusted R Square Std. Error of the Estimate Model R R Square 1 .843a .711 .707 7.812812 a. Predictors: (Constant), Fuel efficiency, Horsepower Coefficientsa Standardized Coefficients Beta Sig 2.354 .020 Unstandardized Coefficients Model B Std. Error 1 (Constant) 28.144 11.954 Horsepower 229 .013 Length - 219 Fuel efficiency -.090 .185 a. Dependent Variable: Price in thousands .906 16.989 ,000 .050 - 205 -4.348 .000 -.027 -.488 .627 Model Summary Adjusted R Square Std. Error of the Estimate Model...
From the three three Regression tests, come up with three hypotheses. Regression Method Variables Entered/Removeda Variables...
 From the three three Regression tests, come up with three
hypotheses.
Regression Method Variables Entered/Removeda Variables Model Variables Entered Removed 1 TotElectb a. Dependent Variable: Variety Seeking b. All requested variables entered. Enter Model Summary Adjusted R R Square Square .009 .002 Model R Std. Error of the Estimate .64205 1 .0958 a. Predictors: (Constant), TotElect Coefficients a Standardized Coefficients Model Unstandardized Coefficients B Std. Error 3.667 . 108 Beta t Sig. .000 1 (Constant) 34.075 TotElect .008 .007 .095...
From the three three Regression tests, come up with three
hypotheses.
Regression Method Variables Entered/Removeda Variables Model Variables Entered Removed 1 TotElectb a. Dependent Variable: Variety Seeking b. All requested variables entered. Enter Model Summary Adjusted R R Square Square .009 .002 Model R Std. Error of the Estimate .64205 1 .0958 a. Predictors: (Constant), TotElect Coefficients a Standardized Coefficients Model Unstandardized Coefficients B Std. Error 3.667 . 108 Beta t Sig. .000 1 (Constant) 34.075 TotElect .008 .007 .095...
QUESTION 6 Model Summary Model R R Square Adjusted R Square Std. Error of the Estimate...
QUESTION 6 Model Summary Model R R Square Adjusted R Square Std. Error of the Estimate 1 .641a .410 .406 4.507 a. Predictors: (Constant), age 3 groups, Total Mastery, Total Optimism Coefficientsa Model Unstandardized Coefficients Standardized Coefficients t Sig. B Std. Error Beta 1 (Constant) 50.016 1.409 35.508 .000 Total Mastery -.786 .067 -.526 -11.719 .000 Total Optimism -.217 .060 -.164 -3.623 .000 age 3 groups -.712 .275 -.098 -2.588 .010 a. Dependent Variable: Total perceived stress What proportion of...
Models 1-7 are below Part C: Select one model you would use to explain reading ability.,Then use that model to find the 95% confidence interval estimate for the mean reading ability 95% p...
 Models 1-7 are below
Part C: Select one model you would use to explain reading ability.,Then use that model to find the 95% confidence interval estimate for the mean reading ability 95% prediction interval for reading ability When age 6, mem span 4.2 and ig 91. Regression [DataSetll C:\Usersn.little5773 Downloads\child data.sav Variables Entered/Removed Variables Entered Variables Removed Method Model Enter age a. Dependent Variable: reading ability b. All requested variables entered. Model Summary Adjusted R Square Std. Error o R...
Models 1-7 are below
Part C: Select one model you would use to explain reading ability.,Then use that model to find the 95% confidence interval estimate for the mean reading ability 95% prediction interval for reading ability When age 6, mem span 4.2 and ig 91. Regression [DataSetll C:\Usersn.little5773 Downloads\child data.sav Variables Entered/Removed Variables Entered Variables Removed Method Model Enter age a. Dependent Variable: reading ability b. All requested variables entered. Model Summary Adjusted R Square Std. Error o R...
Model Summary Model R R Square Adjusted R Square Std. Error of the Estimate 1 .884a...
Model Summary Model R R Square Adjusted R Square Std. Error of the Estimate 1 .884a .782 .775 1134.08895 a. Predictors: (Constant), Tuition2000 Coefficientsa Model Unstandardized Coefficients Standardized Coefficients t Sig. B Std. Error Beta 1 (Constant) 1133.148 701.455 1.615 .116 Tuition2000 1.692 .160 .884 10.551 .000 a. Dependent Variable: Tuition2008 What is the regression equation? What is the percent of variation in BMI explained by the regression line? Predict 2008 Tuition for Oregon given their 2000 tuition rate. Predict...
Linear regression analysis of the data revealed the following: Model Summary Model R R Square Adjusted...
Linear regression analysis of the data revealed the following: Model Summary Model R R Square Adjusted R Square Std. Error of the Estimate 1 .695a .483 .478 13.02473 a. Predictors: (Constant), exercise, gender, subject's age, depressed state of mind ANOVAa Model Sum of Squares df Mean Square F Sig. 1 Regression 65230.870 4 16307.718 96.129 .000b Residual 69893.149 412 169.644 Total 135124.019 416 a. Dependent Variable: Life Purpose and Satisfaction b. Predictors: (Constant), exercise, gender, subject's age, depressed state of...
The following questions refer to the output shown below. Researchers used temperature to predict failure time...
 The following questions refer to the output shown below.
Researchers used temperature to predict failure time for a
superconductive material with the following
a. Write the regression equation based on the results shown
below.
b. Assess the model utility.
linear model: yˆ = β0 + β1xtemp
Write the regression equation based on the results shown
below.
Would you recommend the model? Why or why not?
Model Summary Adjusted R Model R R Square Square .918a .843 .835 a. Predictors: (Constant),...
The following questions refer to the output shown below.
Researchers used temperature to predict failure time for a
superconductive material with the following
a. Write the regression equation based on the results shown
below.
b. Assess the model utility.
linear model: yˆ = β0 + β1xtemp
Write the regression equation based on the results shown
below.
Would you recommend the model? Why or why not?
Model Summary Adjusted R Model R R Square Square .918a .843 .835 a. Predictors: (Constant),...
Now consider the following output: Coefficients Unstandardized Coefficients B Std. Error Standardized Coefficients Beta Model t...
 Now consider the following output: Coefficients Unstandardized Coefficients B Std. Error Standardized Coefficients Beta Model t Sig. 1 1.060 .000 (Constant) JobSat Conscience 11.657 .070 -2.237 250 .026 10.992 279 -8.611 .781 260 -.817 .000 a. Dependent Variable: CWB 6. After seeing this output table above, which predictor(s) is/are significant in the multiple regression equation? Conscience 7. Write the results for the unstandardized coefficients in this multiple regression in APA format. a. b. 8. Interpret the results from the table...
 With each hybrid automobile model, prepare a summary that does the following: 2. Interprets the directional of the relationship of each statistically significant independent variable with respect to the preference for the hybrid model concerned. Independent variables as they join to predict the preferences for the hybrid model concerned Coefficients Model Unstandardized Coefficients Standardized Sig Coefficients B Std. Error Beta 6.981 506 13.795 .000 3.694E-007 000 3.383 101 ,001 -1.315 098 -13.442 -.531 000 -.339 115 -.086 -2.953 ,003 5...
 15.2 Spssx output With each hybrid automobile model, prepare a summary that does the following: 2. Interprets the directional of the relationship of each statistically significant independent variable with respect to the preference for the hybrid model concerned. Coefficients Sig Model Unstandardized Coefficients t Standardized Coefficients Std. Error Beta 000 13.795 6.981 506 3.694E-007 3.383 001 101 .000 -1.315 .098 .531 -13.442 .000 339 -115 .086 -2.953 .003 5 -.026 .004 -260 -6.220 .000 -219 042 -291 -5.207 000 3.073E-006...
 Model Summary Adjusted R Square Std. Error of the Estimate Model R R Square 1 .843a .711 .707 7.812812 a. Predictors: (Constant), Fuel efficiency, Horsepower Coefficientsa Standardized Coefficients Beta Sig 2.354 .020 Unstandardized Coefficients Model B Std. Error 1 (Constant) 28.144 11.954 Horsepower 229 .013 Length - 219 Fuel efficiency -.090 .185 a. Dependent Variable: Price in thousands .906 16.989 ,000 .050 - 205 -4.348 .000 -.027 -.488 .627 Model Summary Adjusted R Square Std. Error of the Estimate Model...
 From the three three Regression tests, come up with three
hypotheses.
Regression Method Variables Entered/Removeda Variables Model Variables Entered Removed 1 TotElectb a. Dependent Variable: Variety Seeking b. All requested variables entered. Enter Model Summary Adjusted R R Square Square .009 .002 Model R Std. Error of the Estimate .64205 1 .0958 a. Predictors: (Constant), TotElect Coefficients a Standardized Coefficients Model Unstandardized Coefficients B Std. Error 3.667 . 108 Beta t Sig. .000 1 (Constant) 34.075 TotElect .008 .007 .095...
From the three three Regression tests, come up with three
hypotheses.
Regression Method Variables Entered/Removeda Variables Model Variables Entered Removed 1 TotElectb a. Dependent Variable: Variety Seeking b. All requested variables entered. Enter Model Summary Adjusted R R Square Square .009 .002 Model R Std. Error of the Estimate .64205 1 .0958 a. Predictors: (Constant), TotElect Coefficients a Standardized Coefficients Model Unstandardized Coefficients B Std. Error 3.667 . 108 Beta t Sig. .000 1 (Constant) 34.075 TotElect .008 .007 .095...
 Models 1-7 are below
Part C: Select one model you would use to explain reading ability.,Then use that model to find the 95% confidence interval estimate for the mean reading ability 95% prediction interval for reading ability When age 6, mem span 4.2 and ig 91. Regression [DataSetll C:\Usersn.little5773 Downloads\child data.sav Variables Entered/Removed Variables Entered Variables Removed Method Model Enter age a. Dependent Variable: reading ability b. All requested variables entered. Model Summary Adjusted R Square Std. Error o R...
Models 1-7 are below
Part C: Select one model you would use to explain reading ability.,Then use that model to find the 95% confidence interval estimate for the mean reading ability 95% prediction interval for reading ability When age 6, mem span 4.2 and ig 91. Regression [DataSetll C:\Usersn.little5773 Downloads\child data.sav Variables Entered/Removed Variables Entered Variables Removed Method Model Enter age a. Dependent Variable: reading ability b. All requested variables entered. Model Summary Adjusted R Square Std. Error o R...
 The following questions refer to the output shown below.
Researchers used temperature to predict failure time for a
superconductive material with the following
a. Write the regression equation based on the results shown
below.
b. Assess the model utility.
linear model: yˆ = β0 + β1xtemp
Write the regression equation based on the results shown
below.
Would you recommend the model? Why or why not?
Model Summary Adjusted R Model R R Square Square .918a .843 .835 a. Predictors: (Constant),...
The following questions refer to the output shown below.
Researchers used temperature to predict failure time for a
superconductive material with the following
a. Write the regression equation based on the results shown
below.
b. Assess the model utility.
linear model: yˆ = β0 + β1xtemp
Write the regression equation based on the results shown
below.
Would you recommend the model? Why or why not?
Model Summary Adjusted R Model R R Square Square .918a .843 .835 a. Predictors: (Constant),...
 Now consider the following output: Coefficients Unstandardized Coefficients B Std. Error Standardized Coefficients Beta Model t Sig. 1 1.060 .000 (Constant) JobSat Conscience 11.657 .070 -2.237 250 .026 10.992 279 -8.611 .781 260 -.817 .000 a. Dependent Variable: CWB 6. After seeing this output table above, which predictor(s) is/are significant in the multiple regression equation? Conscience 7. Write the results for the unstandardized coefficients in this multiple regression in APA format. a. b. 8. Interpret the results from the table...
Most questions answered within 3 hours.
-
Write a program to solve the Josephus problem, with the following
modification:
Sample Input:
./a.out n...
asked 1 hour ago -
At the start of a CD it is spinning at a rate of 525 rpm
(revolutions...
asked 2 hours ago -
4. Without doing any calculations, predict whether the observed
∆T would increase, decrease or remain the...
asked 3 hours ago -
Based on the range, which of the following sets of scores has
the greatest variability? 3,...
asked 4 hours ago -
Ripples in a pond travel at a velocity of 3 m/s with one peak
passing a...
asked 4 hours ago -
A man stands on the roof of a building of height 13.0 mm and
throws a...
asked 4 hours ago -
The extent to which assets are financed by borrowed funds and
other liabilities is indicated by:...
asked 5 hours ago -
Explain in detail
Germany is the fifth largest economy
explain what goods and services Germany specializes...
asked 5 hours ago -
The density of platinum is 21.45 g/mL. If a cube of platinum
with a mass of...
asked 5 hours ago -
Accounts Receivable
Sales
A/R Posting
Extended Sales Invoice
Packing Slip
Compare invoice to packing slip 2...
asked 5 hours ago -
Michaella, age 23, is a full-time law student and is claimed by
her parents as a...
asked 5 hours ago -
Why are polymers not typically casted into products?
asked 6 hours ago